Blog
User Strategies
Does Google Analytics Have Heatmaps? What GA4 Offers and Where It Stops
GA4 doesn't have a built-in heatmap — Google deprecated it in 2017. Here's what GA4 actually tracks, where it falls short, and how to layer heatmaps on top to see why visitors aren't converting.
Lucky Orange
The short answer: no. GA4 doesn't have a built-in heatmap, and Google's previous heatmap tool — the Page Analytics Chrome extension — was deprecated in 2017 and isn't compatible with GA4. If you want heatmaps, you need a separate tool that runs alongside your Google Analytics setup.
That said, this isn't a problem. It's a design decision that reflects what GA4 was built to do — and understanding that distinction is what separates teams that optimize effectively from teams that spin their wheels on inconclusive tests.
This post covers what GA4 actually tracks, where it runs out of answers, and how to add Google Analytics heatmap functionality to your workflow without replacing anything you already use.
What GA4 actually tracks
GA4 is an event-based analytics platform. Every interaction on your site — page views, clicks, scrolls, form submissions, purchases — can be captured as an event, and GA4 aggregates those events into reports that show you how traffic behaves at scale.
Where GA4 genuinely excels:
Traffic and acquisition. GA4 tells you where visitors come from — organic search, paid, email, direct, referral — and how those channels perform relative to each other. This is foundational for budget allocation and campaign measurement.
Funnel and path analysis. GA4's Exploration reports include funnel visualization and path analysis. You can define a conversion funnel, see where users drop off at each step, and compare drop-off rates across segments. This is legitimately useful for identifying which pages deserve the most attention.
Audience segmentation. GA4 lets you slice traffic by device, geography, new vs. returning, channel, and custom event parameters. This makes it possible to identify whether a performance problem affects all users or a specific segment.
Conversion measurement. GA4 tracks goal completions and revenue events. If you care about what percentage of sessions result in a desired outcome, GA4 is the right tool for that measurement.
What GA4 doesn't offer — and was never designed to offer — is a visual representation of how users interact with a specific page. It has no click maps, no scroll depth visualization by page element, and no session-level replay. Those capabilities require a different category of tool.
How to add heatmaps to your Google Analytics 4 workflow
Since GA4 doesn't include native heatmap functionality, the standard approach is to run a dedicated heatmap tool in parallel and use GA4 data to direct where you look.
Here's how that workflow runs in practice:
Step 1 — Use GA4 to identify underperforming pages.
Look at your funnel drop-off reports, bounce rates by landing page, and conversion rates across key entry points. GA4 will surface the pages where performance is weakest — that's your heatmap priority list.
Step 2 — Install a heatmap tool like Lucky Orange.
Add the tracking code to your site (or deploy it via Google Tag Manager alongside your GA4 tag). Lucky Orange heatmaps capture clicks, scroll depth, and mouse movement automatically — no manual event configuration required.
Step 3 — Use heatmaps to diagnose what GA4 flagged.
Pull up the heatmap for the pages GA4 identified as problems. Look for where clicks cluster on non-clickable elements, where scroll depth drops off relative to your CTA placement, and which page sections get ignored entirely.
Step 4 — Validate with session recordings.
Once you have a hypothesis from the heatmap, watch session recordings filtered to that page. You'll see the exact friction in real user journeys — not inferred from aggregates, but observed directly.
Step 5 — Measure the fix in GA4.
Make the change, monitor it in GA4, and confirm the conversion rate moved. GA4 closes the loop on what heatmaps helped you find.
This is the workflow high-performing teams actually use. GA4 and heatmaps aren't competing tools — they answer different questions at different stages of the same process.
What Google Analytics tells you vs. what heatmaps show you
If you're coming to this post because you're wondering whether GA4 is enough for optimization work, the honest answer is: it depends on what you're trying to do.
For measurement, reporting, attribution, and performance monitoring — GA4 is the right tool and there's no reason to replace it. These are exactly the jobs it was built for.
For optimization — understanding why a page underperforms and what specifically to change — GA4 is the starting point, not the finish line. Once you identify a problem in GA4, you need behavioral data to diagnose it.
Consider a concrete example. GA4 shows you a landing page converting at 1.4% when your benchmark is 3%. It can confirm the drop-off happens before the form submission. But GA4 can't show you whether users saw the CTA, whether the page layout pushed key content below the fold, whether users clicked on elements that weren't interactive, or whether the form itself caused the abandonment.
A heatmap answers all of those questions in about two minutes. A session recording shows you the exact moment a user gave up and why.
Without that layer, optimization becomes guesswork — teams debate copy changes and run A/B tests on hypotheses that behavioral data would have confirmed or eliminated in minutes.
What website heatmaps show that GA4 can't
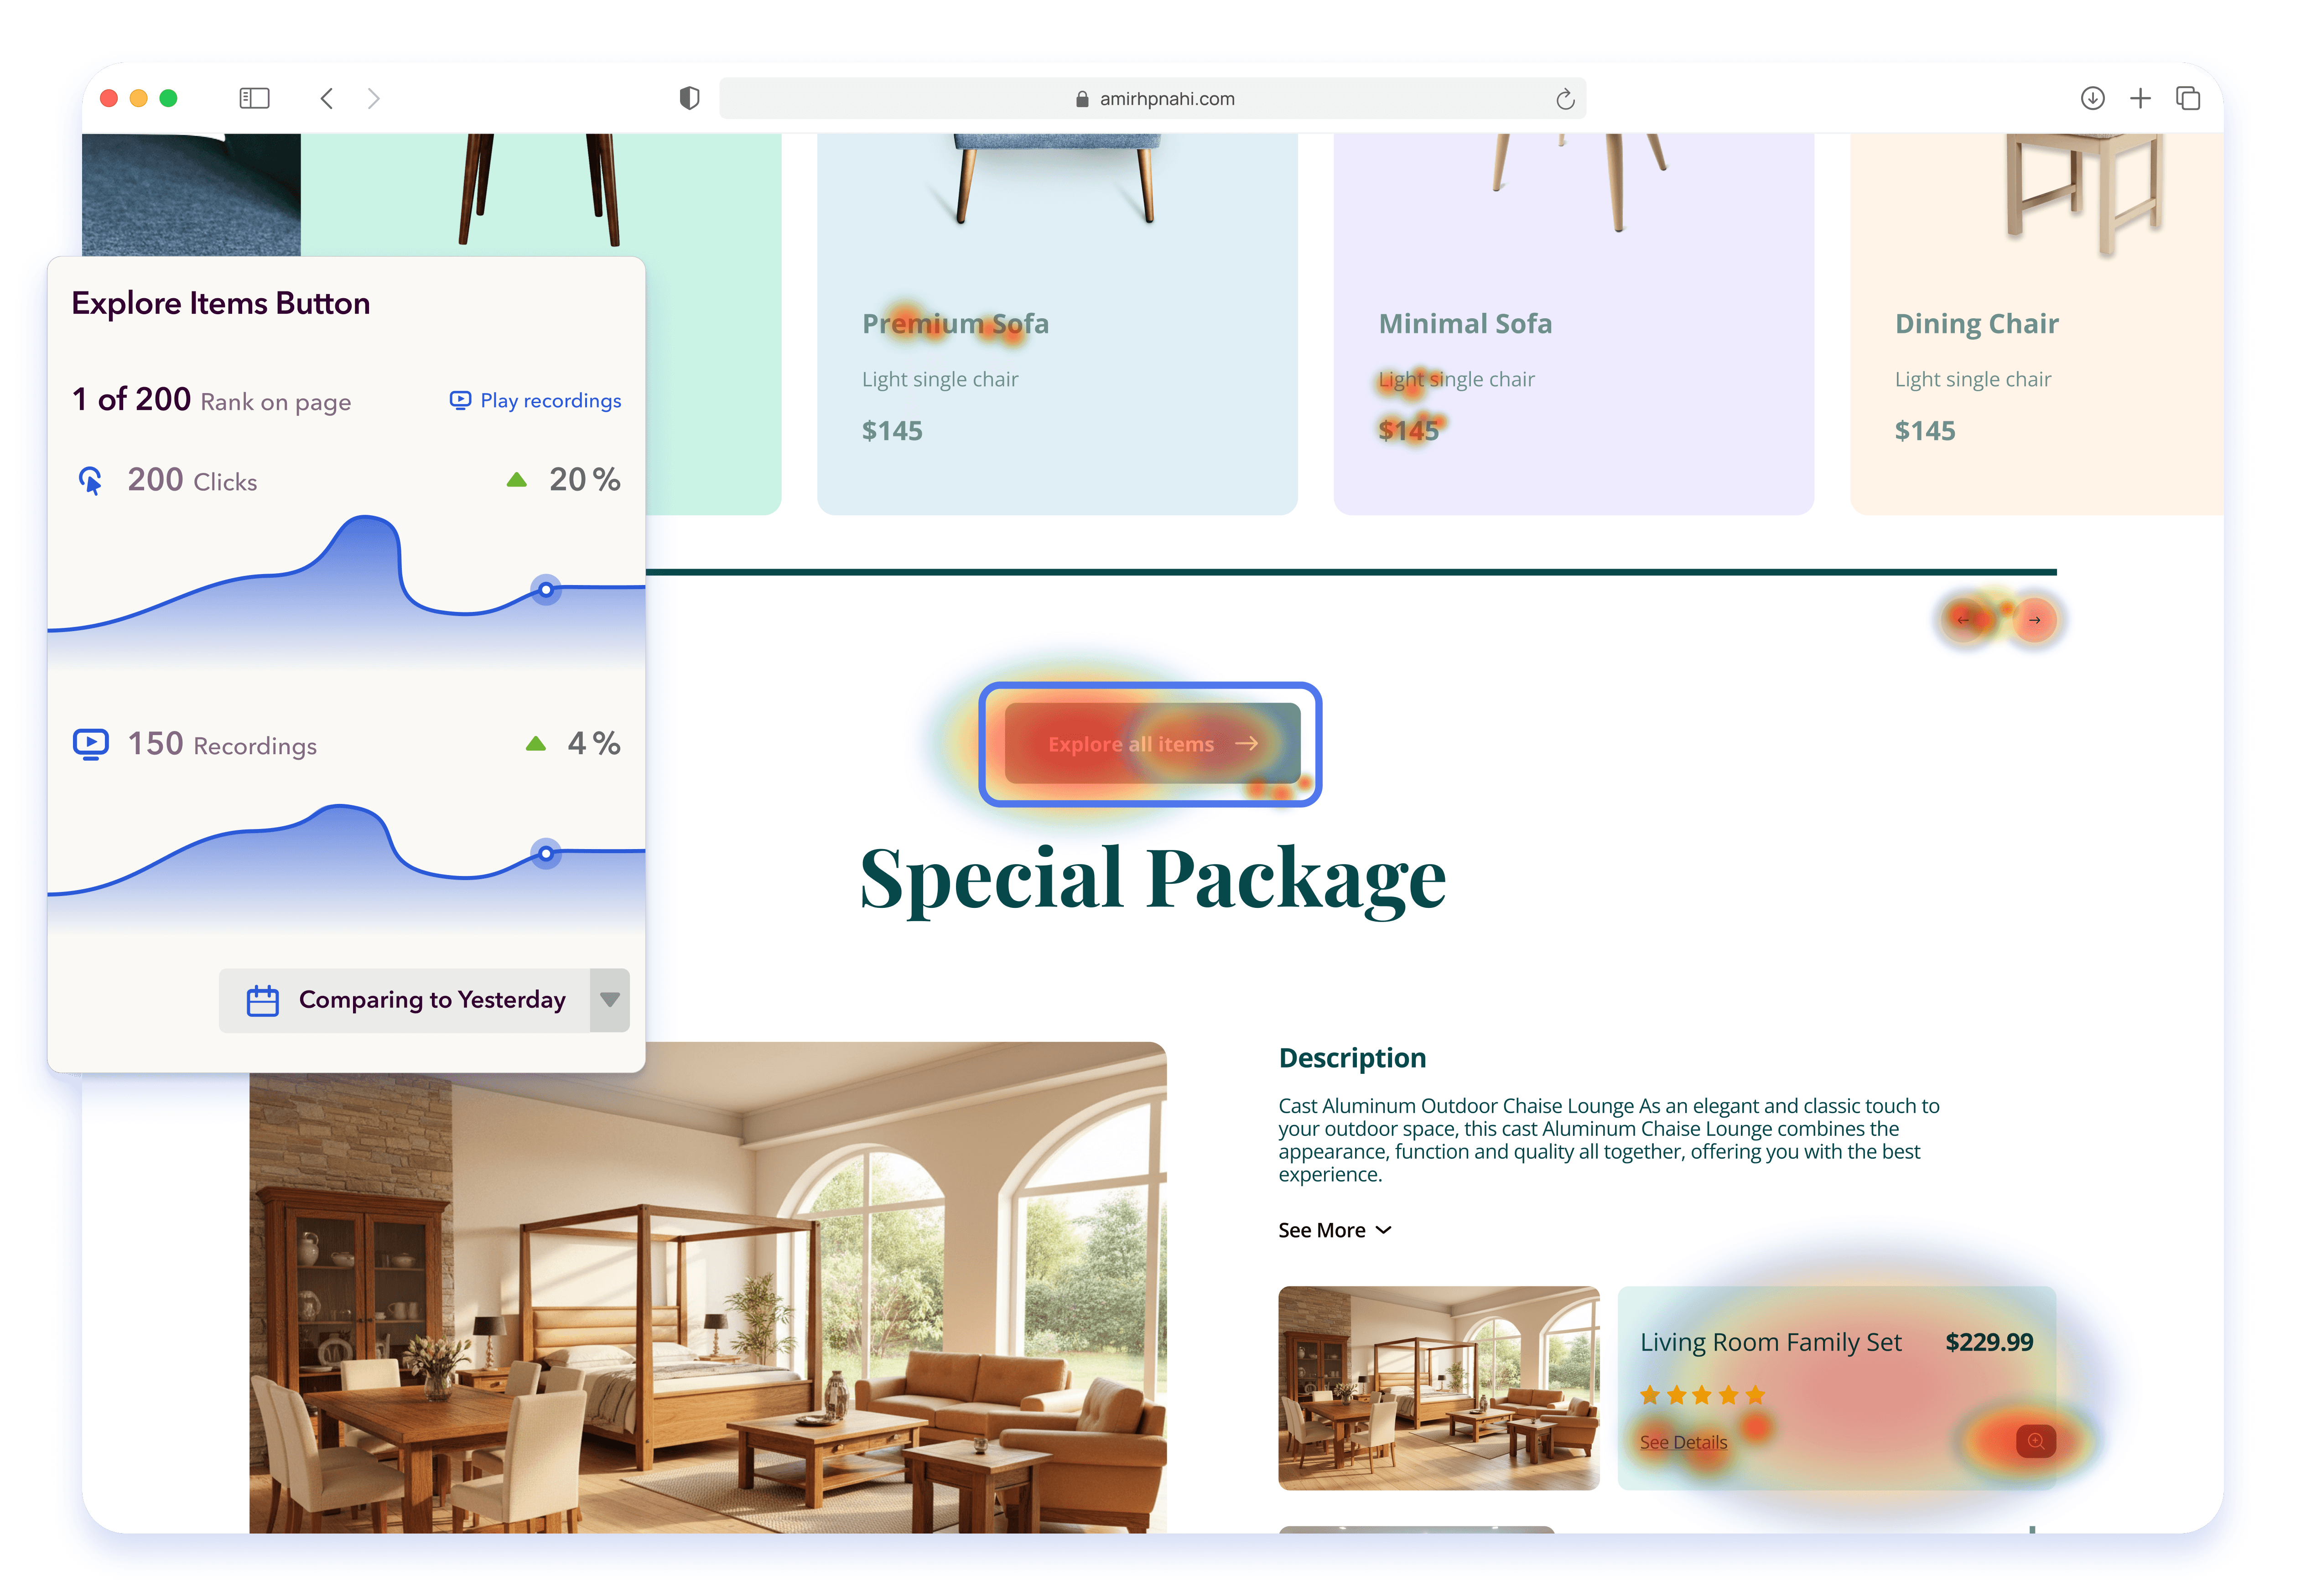
Click maps show exactly where users click on a page — including elements that aren't designed to be clickable. If users are repeatedly clicking on a static image expecting it to expand, or clicking on text that looks like a link but isn't, GA4 has no way to surface that. A click map shows it immediately.
Scroll maps show how far down the page users actually reach. If your primary CTA sits below the point where 60% of users stop scrolling, that's a fixable problem — but GA4's scroll depth events only give you aggregate percentages, not a visual overlay showing where your specific page elements fall relative to user attention.
Move maps show where users hover and hesitate. This is a strong proxy for where attention lands before a click decision. Elements that attract hovering but not clicking often signal confusing UI or mismatched expectations.
Session recordings capture individual user journeys end-to-end. You can filter by page, by behavior, by traffic source, or by outcome (converted vs. didn't convert) and watch exactly what happened. This is the fastest way to move from a GA4 anomaly to a specific, testable diagnosis.
Form analytics show field-level behavior — which fields users skip, where they abandon the form, how long they hesitate on specific inputs. GA4 can tell you the form was abandoned. It can't tell you which field caused it.
The real cost of relying on GA4 alone
When teams skip behavioral data, conversion rate optimization slows down in ways that are hard to attribute but expensive over time.
Changes get made based on opinion rather than observation. Tests run longer because the hypothesis was poorly formed. Obvious UX problems survive multiple redesigns because no one can actually see them. Pages get rebuilt instead of adjusted because the real issue — a single misplaced element or a confusing label — was never identified.
The problem isn't bad data. GA4's data is accurate. The problem is that accurate aggregate data doesn't tell you where to look on the page, and that's exactly what heatmaps are designed to do.
Why some teams end up leaving GA4 behind entirely
Worth noting: while the GA4 + heatmaps workflow above is the standard starting point, a meaningful number of Lucky Orange users find themselves using GA4 less and less once they're inside the platform.
The reason is straightforward. Lucky Orange's analytics views — traffic sources, session data, conversion funnels, form analytics — are built into the same interface as the heatmaps and recordings. You're not switching between tabs or cross-referencing two dashboards to connect a data point to a page behavior. The quantitative context and the visual behavioral data live in the same place, attached to the same sessions.
For a lot of teams, especially smaller ones without a dedicated analytics function, that consolidation is a significant workflow change. Instead of identifying a problem in GA4 and then opening Lucky Orange to diagnose it, you're doing both in one pass. Traffic drops, funnel anomalies, and behavioral friction all surface in the same view.
Discovery AI takes this further — it automatically surfaces what's worth your attention across heatmaps, recordings, and analytics data, so you're not manually hunting for the signal. For teams that were already using GA4 primarily as a "where do I look next" compass, Discovery AI replaces that function entirely.
None of this means GA4 is the wrong tool. For attribution modeling, cross-channel reporting, and stakeholder dashboards, GA4 remains the standard. But if your primary use of GA4 has been finding pages to optimize, Lucky Orange's integrated analytics layer often handles that job — and then immediately shows you what to do about it.
Frequently asked questions
Does Google Analytics have a heatmap? No. GA4 doesn't include native heatmap functionality. Google's previous heatmap tool — the Page Analytics Chrome extension — was deprecated in 2017 and doesn't work with GA4. To get heatmaps, you need a separate tool like Lucky Orange that runs alongside your GA4 setup.
Did Google Analytics ever have a built-in heatmap? Yes — Google offered an In-Page Analytics feature and later a Page Analytics Chrome extension that showed click percentages on links. It was deprecated in 2017. It was also limited to basic click data on links only, not the full click, scroll, and move visualization that modern heatmap tools provide.
Can I use GA4 to see where users click on my page? Only partially. GA4 can capture click events if you configure enhanced measurement or set up custom events via Google Tag Manager. But it returns a list of clicked elements and percentages — not a visual overlay on the page. A click heatmap shows you the same data as a spatial visualization, which is much faster to interpret.
Do I need both Google Analytics and a heatmap tool? Yes, and they serve different purposes. GA4 is for measurement — traffic, attribution, funnel performance, conversion tracking. Heatmap tools are for diagnosis — understanding what's happening on the page and why. You need both to run a complete optimization program.
How do I add heatmaps to GA4? Install a heatmap tool like Lucky Orange by adding its tracking code to your site, either directly or via Google Tag Manager alongside your GA4 tag. Use GA4 to identify which pages to prioritize, then use Lucky Orange heatmaps and session recordings to diagnose what's causing the performance gap.
What's the difference between a heatmap and Google Analytics? GA4 aggregates behavioral data into reports — it tells you what happened across your traffic at scale. Heatmaps visualize how users interact with a specific page — where they click, how far they scroll, where attention drops off. GA4 identifies that a problem exists. Heatmaps show you where on the page it lives.
The bottom line
GA4 is not a heatmap tool, and heatmap tools are not GA4 replacements. They belong in the same stack at different stages of the same workflow.
Use GA4 to find where performance drops. Use Lucky Orange heatmaps and session recordings to understand why. Make the change. Measure it in GA4.
That loop — identify, diagnose, fix, measure — is what separates optimization programs that compound results from ones that stay busy without moving the needle.
Lucky Orange


