The Best Website Analytics Dashboard For User Behavior
Check website traffic, behavior trends and activity levels in one dashboard. Make smarter changes that drive results.
The Best Website Analytics Dashboard For User Behavior
Check website traffic, behavior trends and activity levels in one dashboard. Make smarter changes that drive results.
Real-World Patterns You Can Spot with
Lucky Orange Dashboards
Lucky Orange web analytics dashboards give you fast visibility into what’s happening across your site. Here are six real examples of insights you might catch—and how Lucky Orange tools help you dig deeper and act with confidence:

Negative chat ratings are increasing
The Chat Ratings card reveals a pattern of low scores.
You dig into chat transcripts and discover slow response times during peak hours—shifting your team’s schedule leads to faster replies and happier customers.

Top traffic source falling off
The Top Pages card shows one of your key product pages is getting far fewer visits.
By reviewing Funnels and Events, you find a broken link from the homepage—fixing it brings traffic (and conversions) back up.

Traffic from one browser drops fast
The Browsers card reveals a sharp decline in visits from Chrome over the past week.
You compare Sources and Top Pages for Chrome users and discover a paid campaign is no longer running—restarting the campaign and checking landing page performance helps recover lost traffic.
Your team is missing key chat times
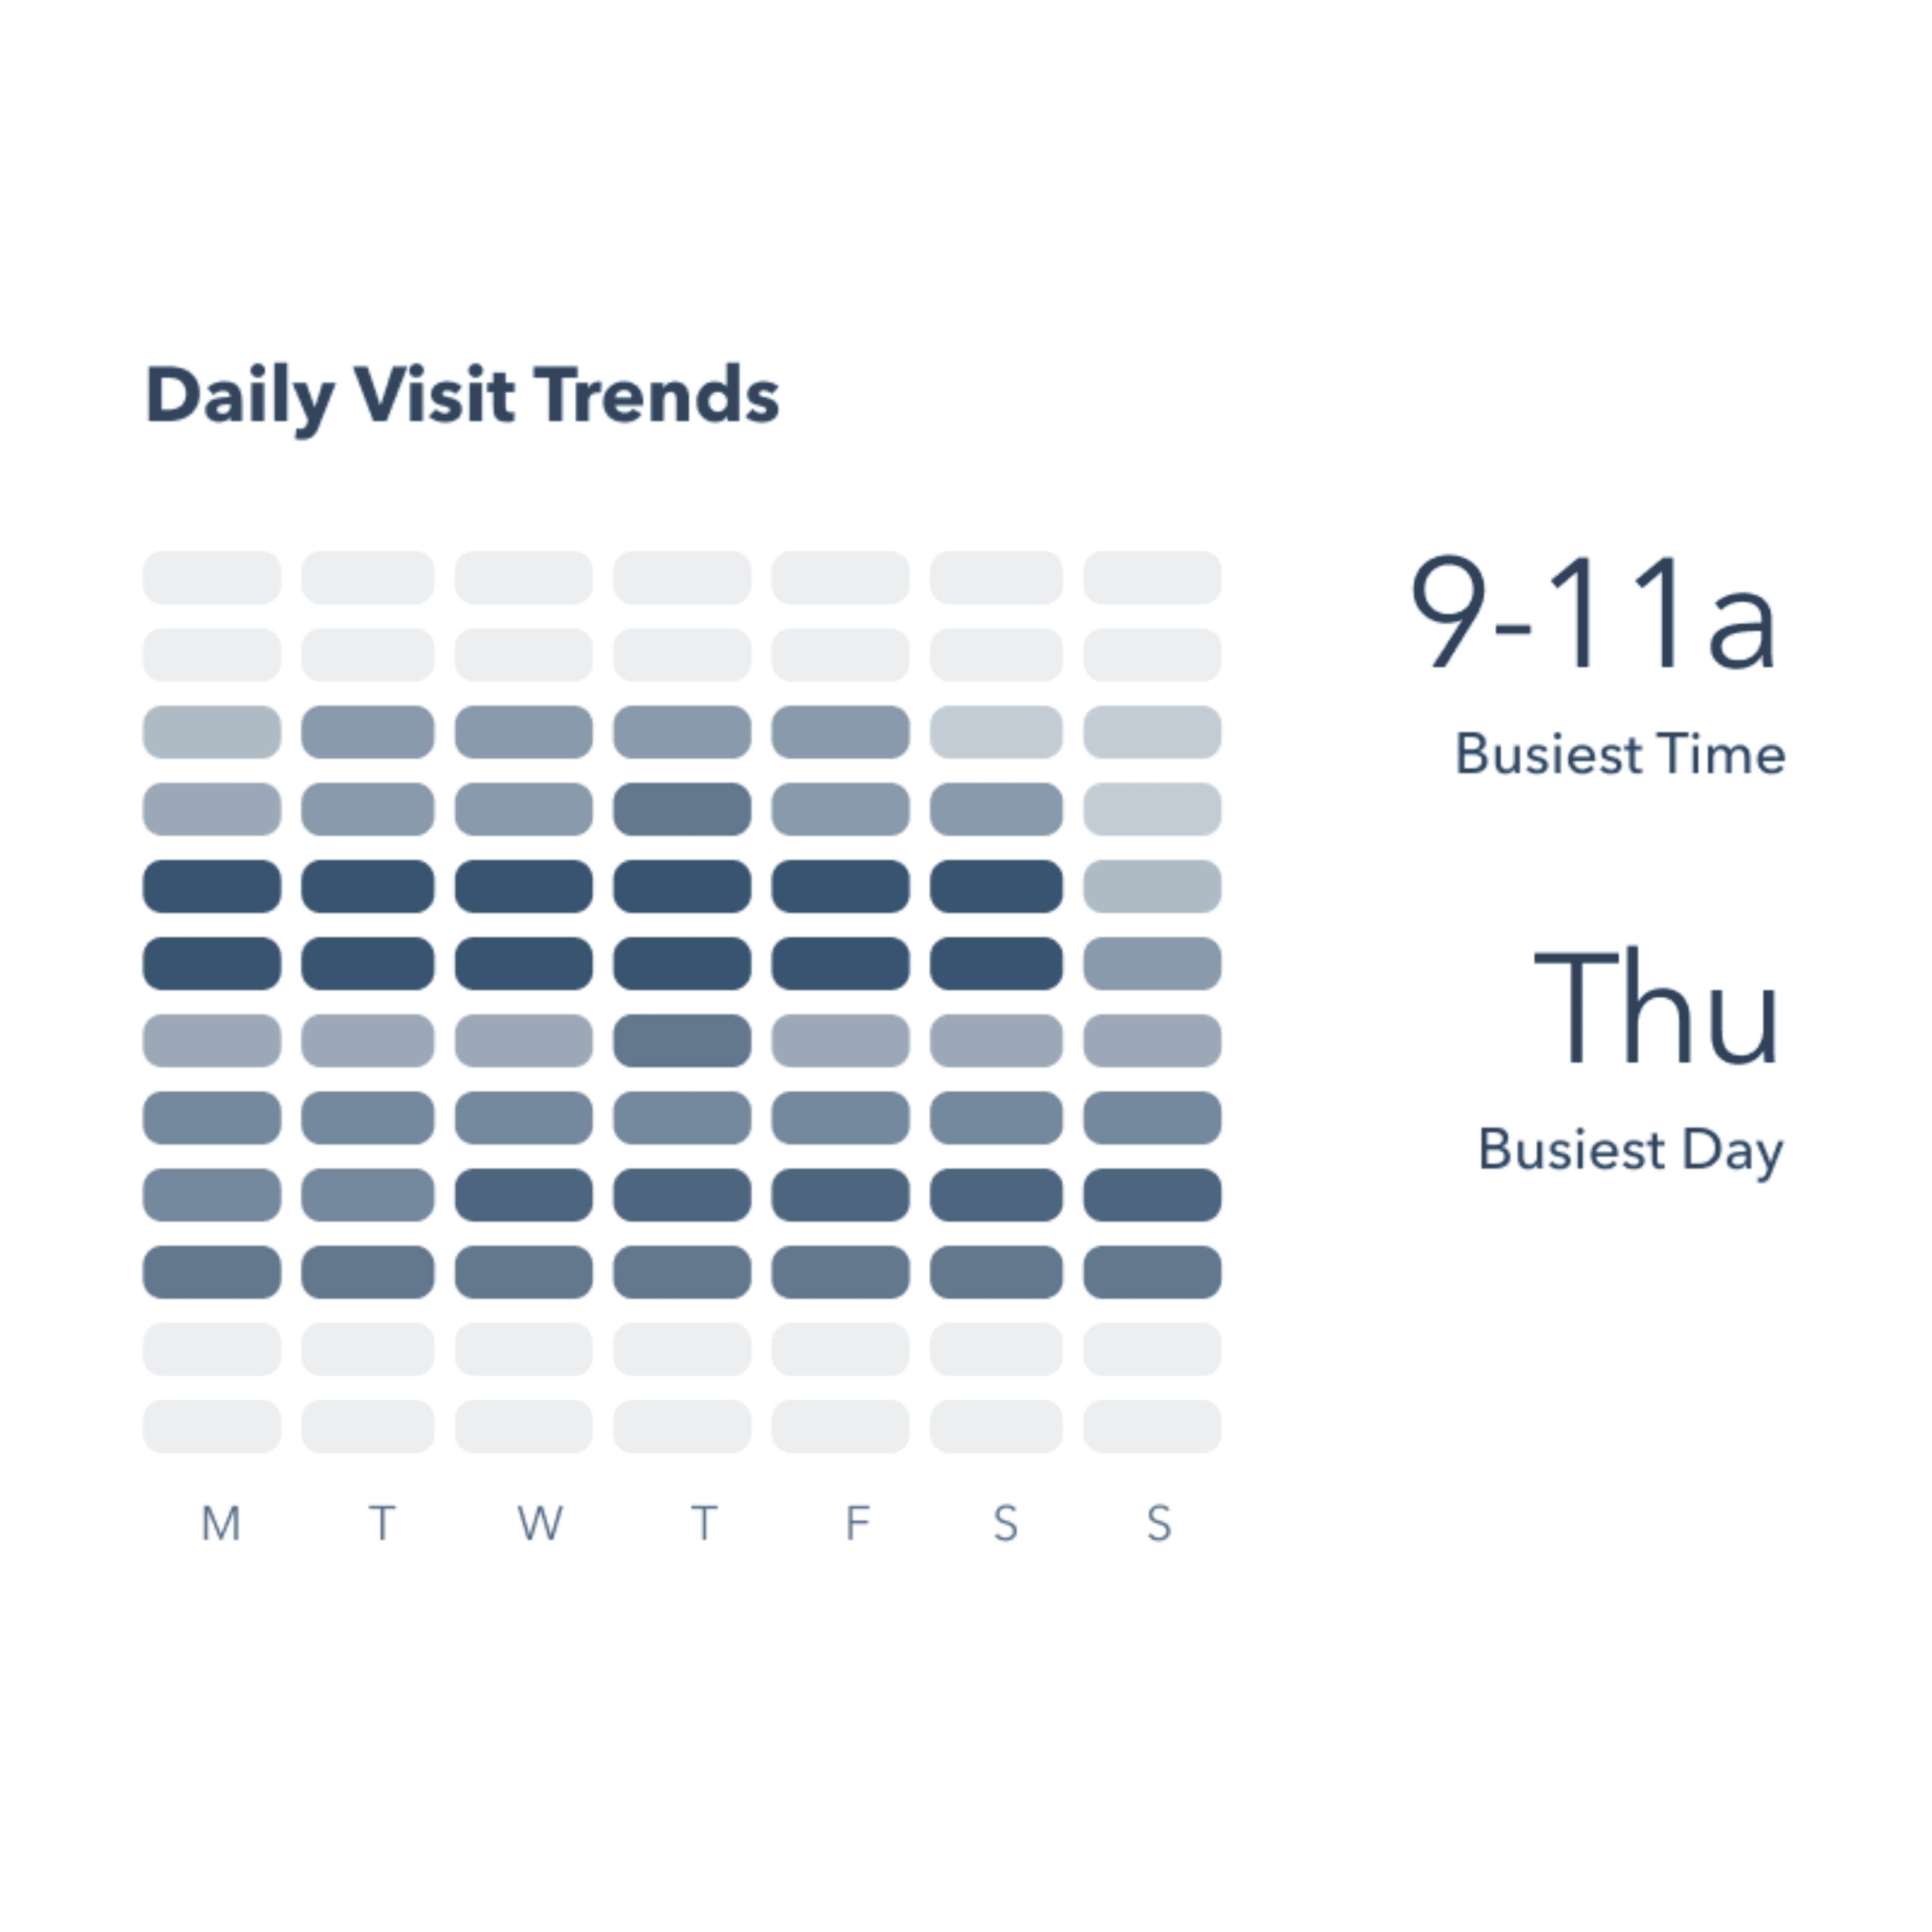
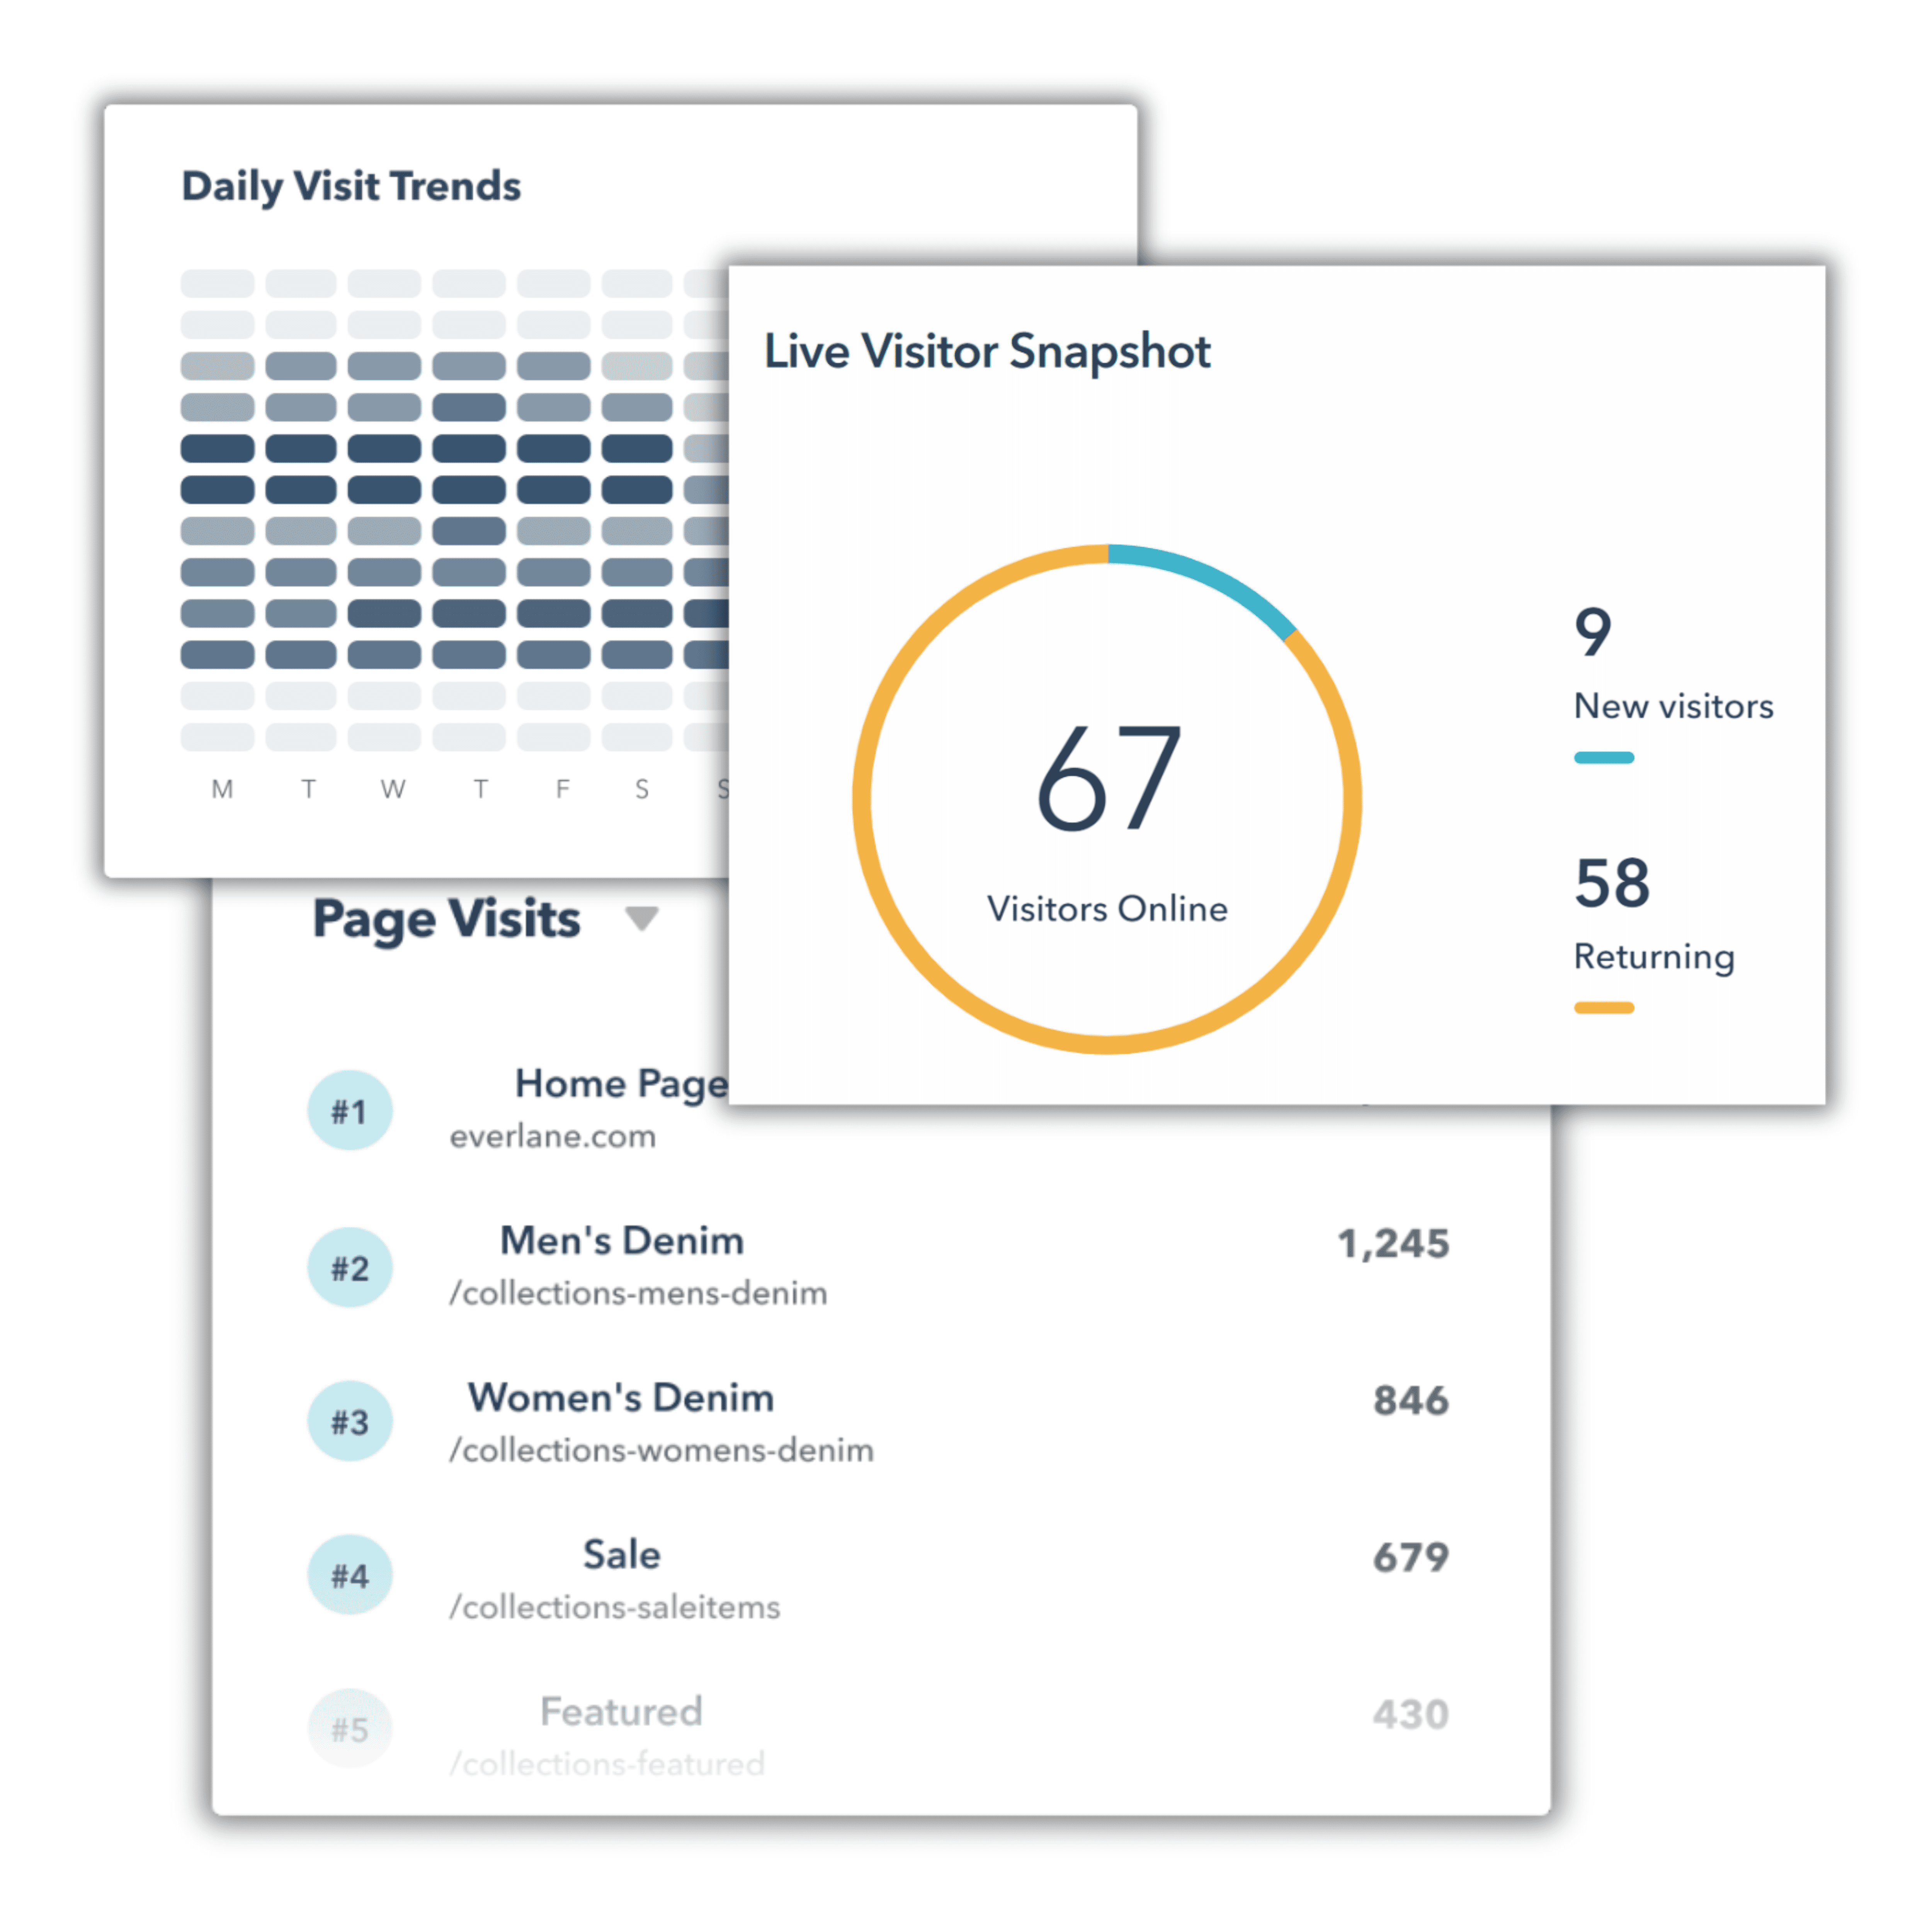
Daily Visit Trends shows an uptick in visitor activity during your non-working hours and the marketing team is missing key opportunities to engage people on Live Chat.

Survey ratings are trending up
The Surveys card shows an increase in average scores over the past week.
You use Session Recordings to watch how users interact before submitting feedback and spot key user interactions.

Shipping info page is seeing a traffic spike
The Top Pages card shows a sudden increase in views to your shipping information page.
Using Funnels and Session Recordings, you discover that customers are leaving product pages to search for shipping details—adding key shipping info directly to product pages reduces friction and boosts add-to-cart rates.
Focus your
optimization efforts
Some visitors don't convert. Let a Lucky Orange analytics dashboard show you where to look first.
Click from key website metrics directly into Session Recordings to study interactions more closely.
Monitor traffic trends from different parts of the world as your audience grows.
Get a high-level view of the entire visitor experience using your site including chat and funnel interactions.
Make unlimited custom dashboards for all of your most important projects.
Key Benefits of Lucky Orange Website Analytics Dashboards
An all-in-one web analytics dashboard like Lucky Orange brings together data
and insight, helping you make informed decisions faster.

All Your Important Metrics at a Glance
See key performance indicators all in one place, from traffic sources to chat trends and funnel steps.
Build custom dashboards that match your goals using flexible, drag-and-drop widgets—no coding required.
Spot Customer Journey Trends and Issues in Real Time
Track live visitor activity and campaign traffic as it happens to stay ahead of performance dips.
Use visual cues and real-time metrics to quickly identify patterns and react before they impact your bottom line.
Dive Deep into Page & Site Performance
Watch how users navigate your top pages through session replays.
Understand visitor trends like quantity of live chat interactions to help focus marketing efforts and improve team workflows.
Trusted By Over 500,000 Websites
Michael L. via G2
Small Business
"Excellent software at an affordable price."
"The dashboard is clear and customizable. The software has been easy to integrate with Wordpress and the customer support has also been fantastic."
Laguna Happy
via Shopify App Store
"Understand the why"
"We installed Lucky Orange and were instantly surprised at the level information we were able to obtain. I have always had data but no other tools give you the “why” around the patterns we were seeing."
Perrie H.
Mid-market
"Lucky Orange is very eye opening"
"Lucky Orange was very easy to implement with one short code to the website. It was great information as we rebuild certain parts of our main website. They also allowed by team to have access to see this as well."
Tracks real-time data with no delay
Get instant actionable insights into visitor activity as it happens—no need to wait for next-day reporting.
Combines user behavior with your most important performance metrics
See what users do and how it affects conversions, all from one unified view.
Custom dashboards without code
Easily build and personalize dashboards to show your most important KPIs—no developer needed.
Instant access to recordings and heatmaps from the dashboard
Click any data point to launch a session replay or heatmap, saving time and guesswork.
Traditional Web Analytics Dashboard
Delay in data means traditional tools often show you outdated insights, making it harder to react quickly.
Only aggregate numbers give totals and averages, but no real understanding of user behavior.
Hard-to-use reports across platforms slow you down by forcing manual work to see the full picture.
Limited customization makes it tough to surface the key metrics that matter most to your team.
Real-World Patterns You Can Spot with
Lucky Orange Dashboards
Lucky Orange web analytics dashboards give you fast visibility into what’s happening across your site.
Here are six real examples of insights you might catch—and how Lucky Orange tools help you dig deeper and act with confidence:
Negative chat ratings are increasing
The Chat Ratings card reveals a pattern of low scores.
You dig into chat transcripts and discover slow response times during peak hours—shifting your team’s schedule leads to faster replies and happier customers.
Top traffic source falling off
The Top Pages card shows one of your key product pages is getting far fewer visits.
By reviewing Funnels and Events, you find a broken link from the homepage—fixing it brings traffic (and conversions) back up.
Traffic from one browser drops fast
The Browsers card reveals a sharp decline in visits from Chrome over the past week.
You compare Sources and Top Pages for Chrome users and discover a paid campaign is no longer running—restarting the campaign and checking landing page performance helps recover lost traffic.
Your team is missing key chat times
Daily Visit Trends shows an uptick in visitor activity during your non-working hours and the marketing team is missing key opportunities to engage people on Live Chat.

Survey ratings are trending downward
The Surveys card shows a drop in average scores over the past week.
You use Session Recordings to watch how users interact before submitting feedback and spot frustrating user interactions—after fixing the issue, ratings improve and survey abandonment drops.
Shipping info is seeing a traffic spike
The Top Pages card shows a sudden increase in views to your shipping information page.
Using Funnels and Session Recordings, you discover that customers are leaving product pages to search for shipping details—adding key shipping info directly to product pages reduces friction and boosts add-to-cart rates.
How Dashboards Make Optimization More Efficient
Lucky Orange web analytics dashboards give you fast visibility into what’s happening across your site. Here are five real examples of insights you might catch—and how Lucky Orange tools help you dig deeper and act with confidence:
UnNotice a dip in conversions? A smart dashboard lets you quickly filter by traffic source or device and identify the issue without digging through multiple reports.
Validate your A/B tests in real time
See how users interact with different page variants and get early signals about which version is winning – without waiting for a full reporting cycle.op off to improve user engagement.
Make meetings more productive
Instead of trying to explain what's broken in digital marketing efforts, pull up your dashboard and walk your team through live performance data.
Prioritize what to fix next
With visibility into session replays, form drop-off, and user behavior patterns, you can quickly decide which page or feature deserves your attention first.
Act faster with context
Unlike traditional tools that just who you bounce rate or pageviews, Lucky Orange pairs numbers with user engagement visuals so you can find the why behind the what.
How Dashboards Make Optimization More Efficient
When it comes to optimizing your website, having the right dashboard turns hours of work into minutes.
Spot issues before they become problems: Notice a dip in conversions? A smart dashboard lets you quickly filter by traffic source or device and identify the issue without digging through multiple reports.
Validate your A/B tests in real time: See how users interact with different page variants and get early signals about which version is winning – without waiting for a full reporting cycle.op off to improve engagement.
Make meetings more productive: Instead of trying to explain what's broken in digital marketing efforts, pull up your dashboard and walk your team through live performance data.
Prioritize what to fix next: With visibility into session replays, form drop-off, and behavior patterns, you can quickly decide which page or feature deserves your attention first.
Act faster with context: Unlike traditional toosl that just who you bounce rate or pageviews, Lucky Orange pairs numbers with user engagement visuals to show you the why behind the what.
Frequently Asked Questions
What is a web analytics dashboard?
What is the best way to track website analytics?
What is an example of a website analytics for digital marketers?
How do I create custom dashboards?
How does Lucky Orange work with Google Analytics and Google Ads?
What metrics should I include in a digital marketing dashboard?
Can I integrate Lucky Orange with GA and others?
Do you have any analytics dashboard examples?
How does a Dashboard help improve conversion rate?
Is it CCPA/GDPR compliant?
Frequently Asked Questions
What is a web analytics dashboard?
What is the best way to track website analytics?
How do I create custom dashboards?
How does Lucky Orange work with Google Analytics and Google Ads?
What metrics should I include in a digital marketing dashboard?
Can I integrate Lucky Orange with Optimizely, Shopify and others?
What is an example of website analytics for digital marketers?
Do you have any analytics dashboard examples?
How does a Dashboard help improve conversion rate?
Is it CCPA/GDPR compliant?
How do I enable Lucky Orange Email Reports?
All-In-One Conversion Optimization Kit
Lucky Orange includes more than just dashboards – it’s a full CRO toolkit.


Session Recordings
Watch replay of specific visitors on your site including all clicks and interactions

All-In-One Conversion Optimization Kit
Lucky Orange includes more than just dashboards – it’s a full CRO toolkit.
Session Recordings
Watch replay of specific visitors on your site including all clicks and interactions