Blog
Conversion Rate Optimization
Session Replay vs. Heatmaps: What's the Difference and When to Use Each
Session replay and heatmaps answer different questions about user behavior. Here's exactly how each works, when to reach for which one, and how to use them together to diagnose conversion problems faster.
Lucky Orange
If your page isn't converting the way it should, you have two behavioral tools that can tell you why: heatmaps and session replay. They're often talked about as alternatives, but they're not — they answer fundamentally different questions, and reaching for the wrong one first will slow you down.
The short version: heatmaps show you what's happening across all your visitors in aggregate. Session replay shows you what happened for one specific visitor in full detail. Both are essential. Neither is a substitute for the other.
This post explains exactly how each works, what questions each one is built to answer, when to use each in a real diagnostic workflow, and how they work together to get you from 'something's wrong with this page' to a specific, testable hypothesis faster than either tool could alone.
What is session replay?
Session replay — also called session recording — captures a visitor's entire interaction with your site and plays it back as a video-like reconstruction. Every click, scroll, mouse movement, form interaction, and page navigation is recorded and stored so you can watch it later exactly as it happened.
It's not a screen recording in the traditional sense. Session replay tools reconstruct the session from logged interaction data, which means the playback is accurate to what the visitor actually experienced — including any dynamic content, popups, or page state changes — without capturing actual video of the user's screen or anything outside your site.
When you watch a session recording, you're seeing your site from the visitor's perspective: where they hesitated, where they got stuck, what they tried to click that didn't work, where they abandoned a form halfway through, and what they did in the seconds before they left. It turns abstract drop-off rates into specific, observable behavior.
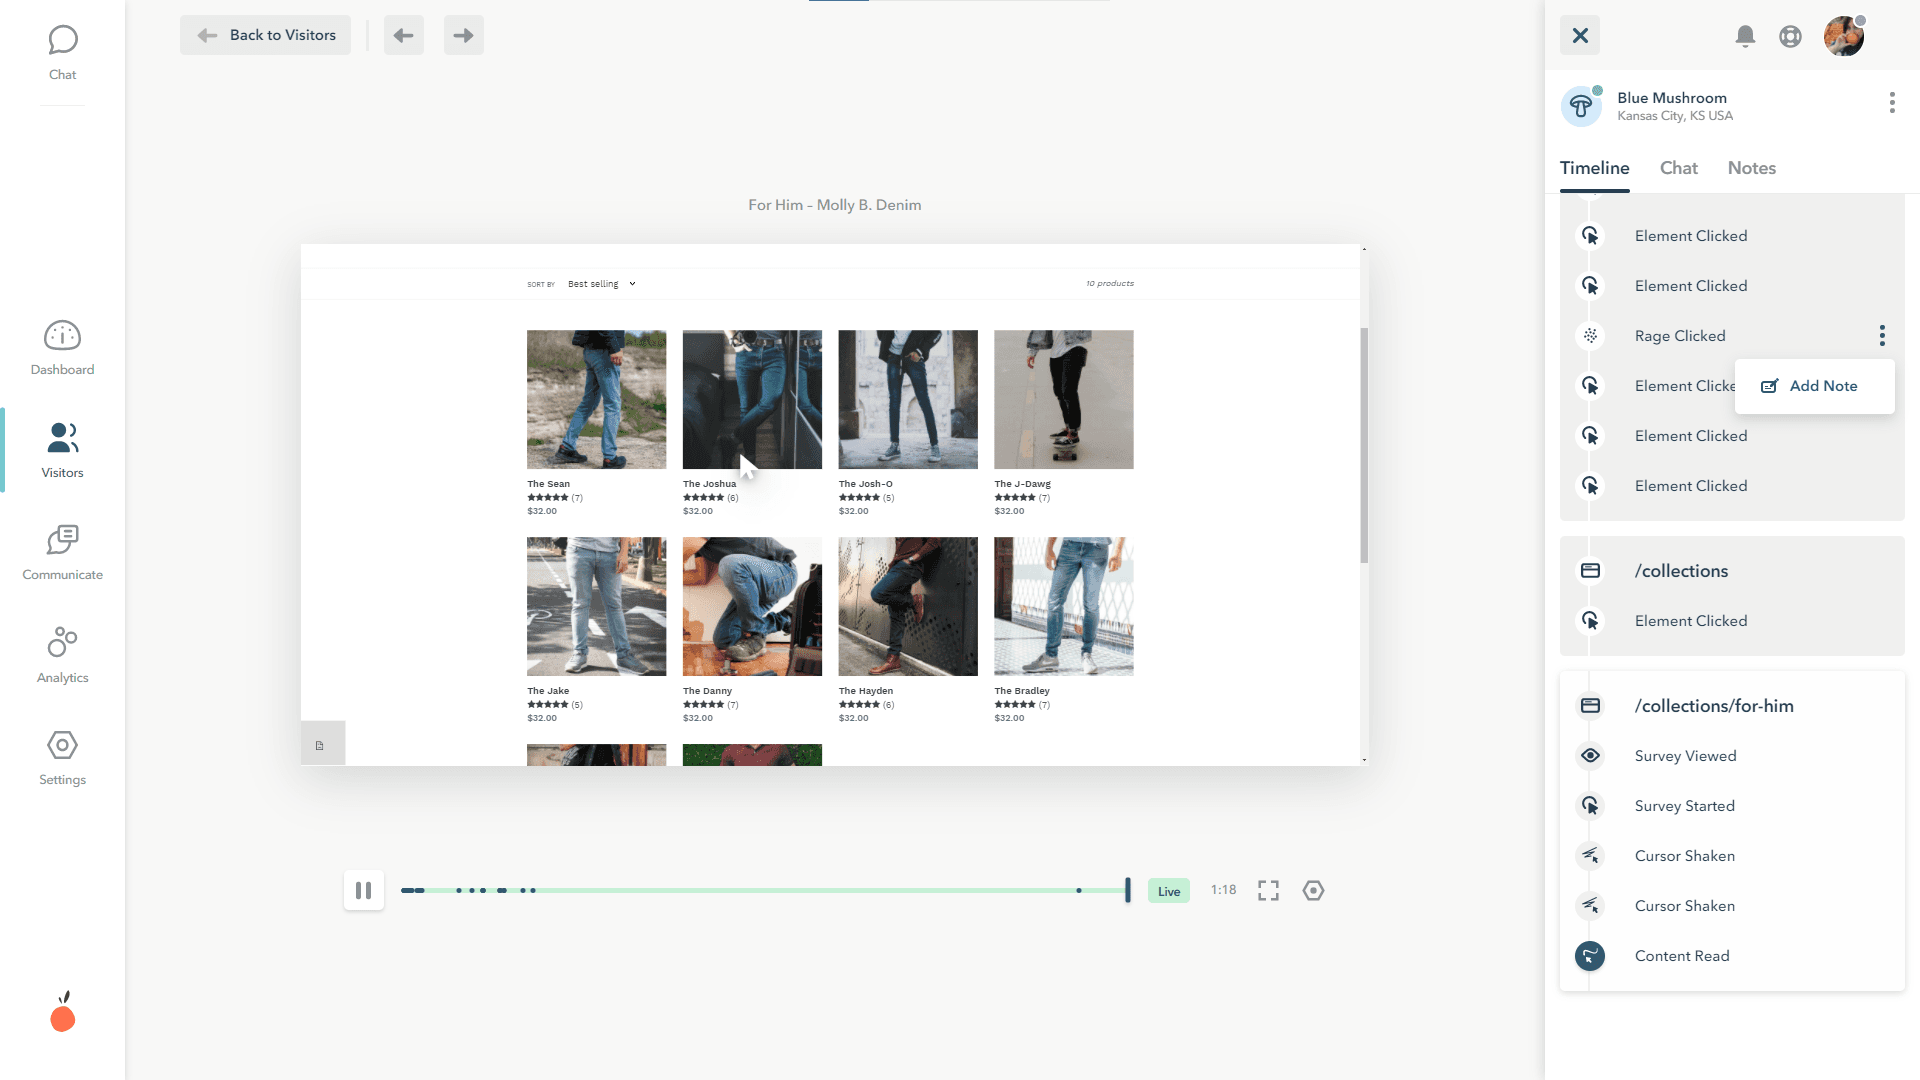
What session replay captures
Mouse movements and clicks — including clicks on non-interactive elements (a signal of user confusion)
Scroll depth and direction — including fast scrolling, which often indicates a user scanning rather than reading
Form interactions — which fields were filled, which were skipped, and where people abandoned mid-form
Rage clicks — rapid repeated clicks on an element, almost always a signal of frustration or a broken interaction
Page navigation — the full path a visitor took across your site in a single session
JavaScript errors — some tools flag errors that occurred during the session, so you can see if a technical issue affected the experience
What is a heatmap?
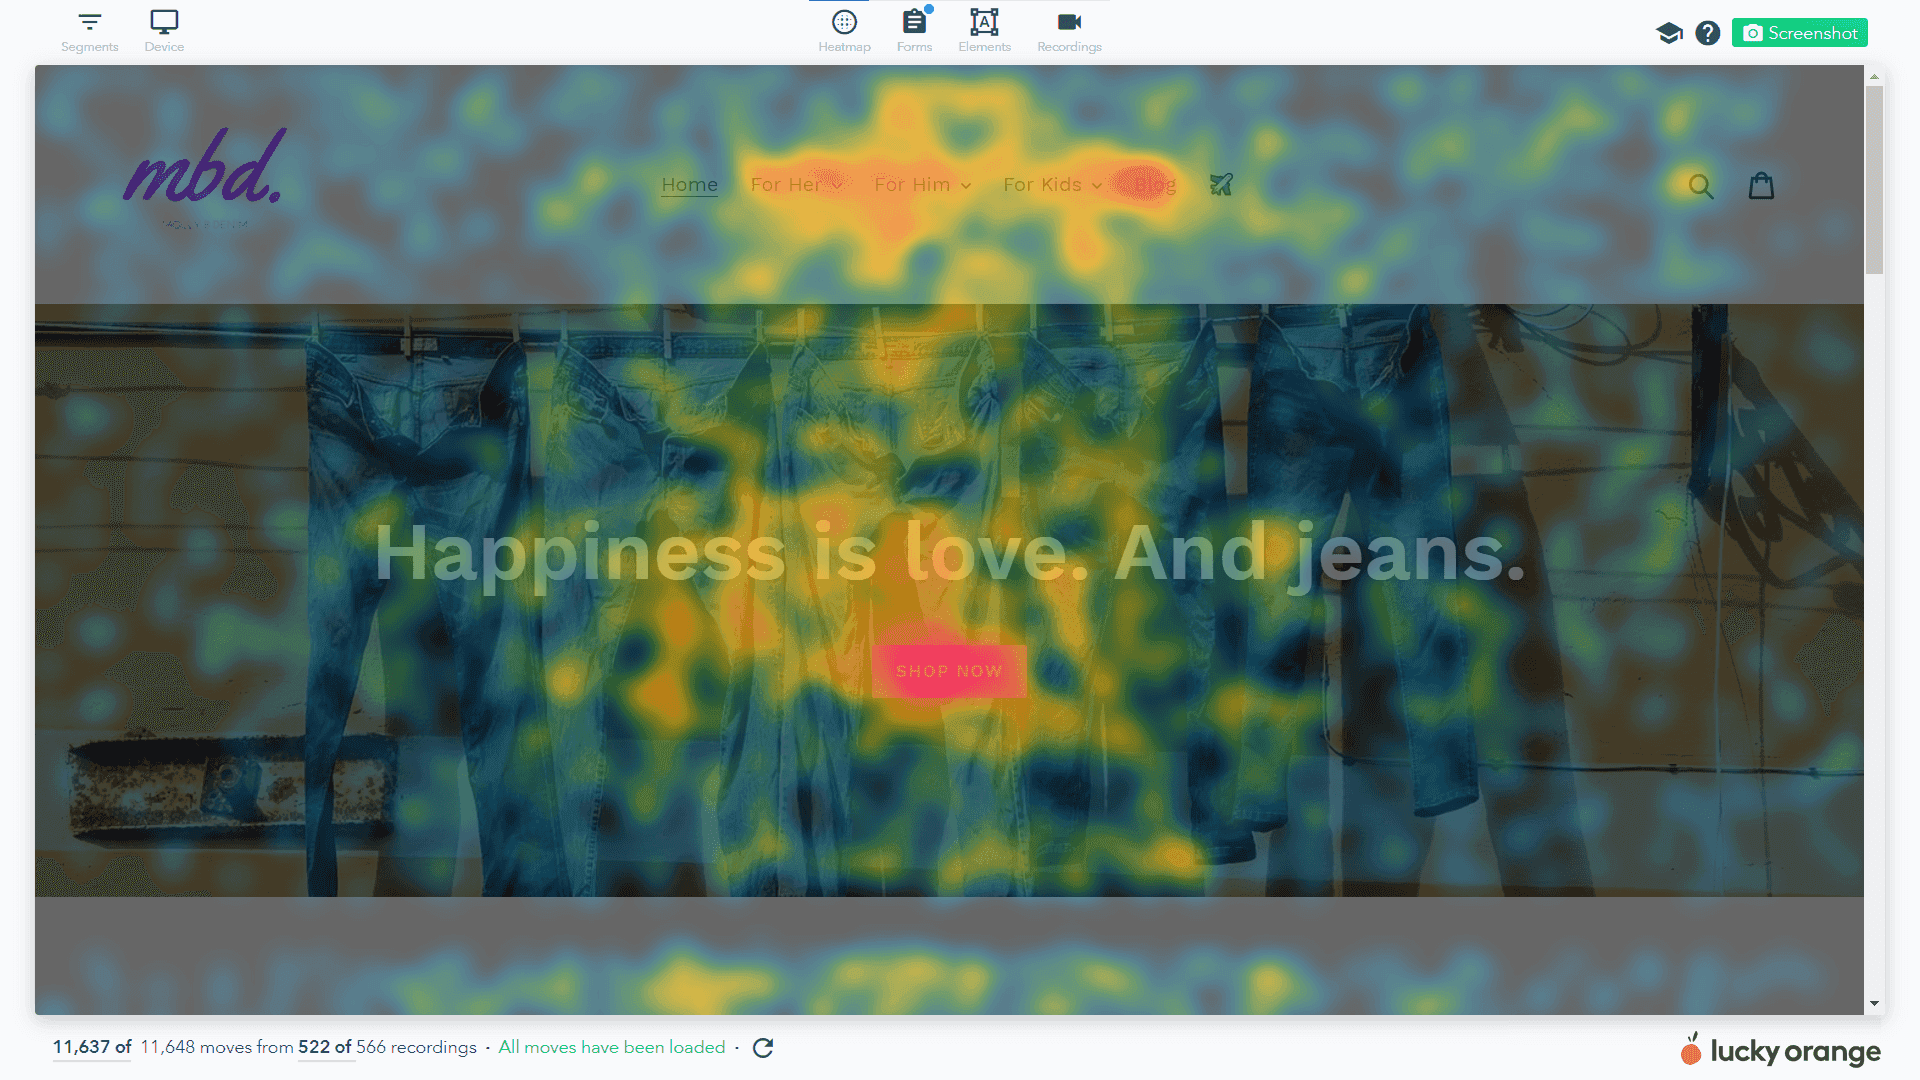
A heatmap aggregates interaction data from hundreds or thousands of sessions and renders it as a color-coded overlay on your page. Warm colors (red, orange) show where most activity concentrates. Cool colors (blue, green) show where it drops off. Blank space means no engagement at all.
Unlike session replay, which shows you one visitor's journey in full detail, a heatmap shows you the pattern across your entire audience. You're not watching what one person did — you're seeing the statistical shape of what most people do.
There are four main types, each answering a different question:
Click maps (example above) — where visitors click, including on elements that aren't clickable
Scroll maps (example below) — how far down the page visitors scroll before leaving (including the effective fold where 50% of visitors in your segment scroll)
Move maps — where visitors hover with their cursor, a proxy for where their attention goes on desktop
Engagement maps — a combined view of multiple signals (clicks, scrolls, time on section) to show overall page attention
The strength of heatmaps is speed and scale. In a few seconds you can see whether your CTA is getting clicked, whether most visitors reach your social proof section, and whether there's a scroll drop-off that corresponds to a problem area — across thousands of sessions at once.
Session replay vs. heatmaps: how they compare
Heatmaps | Session replay | |
|---|---|---|
What it shows | Aggregate patterns across all visitors | Individual visitor journeys in full detail |
Unit of analysis | Entire audience (or segment) | One session at a time |
Best question | What are most visitors doing on this page? | Why did this visitor behave this way? |
Speed of insight | Fast — scan a page in seconds | Slower — requires watching individual sessions |
Sample size needed | 1,000+ sessions for reliable patterns | 10–20 sessions often sufficient to see a pattern |
Blind spots | Can't explain why a pattern exists | Can't tell you if behavior is typical or anomalous |
Best used for | Identifying what's wrong on a page | Diagnosing why it's wrong |
Complements | Session replay (follow up on anomalies) | Heatmaps (confirm findings are widespread) |
When to use a heatmap vs. session replay
The decision isn't really either/or — it's about which one to start with for a given diagnostic question. Here's how to think about it.
Start with a heatmap when you need to scan
Heatmaps are the right first tool when you're looking at a page broadly and don't yet know where the problem is. You're asking: 'What is happening on this page that I should investigate further?' The aggregate view surfaces the anomalies quickly — a cold CTA button, a scroll drop-off at the wrong place, clicks clustering on a non-interactive element.
Reach for a heatmap when:
A page is underperforming and you don't yet know where to look
You've made a change to a page and want to verify whether user behavior shifted
You're auditing a page you haven't looked at in a while
You want to check whether most visitors reach a specific section — a CTA, a pricing block, a testimonial row
You're comparing mobile vs. desktop behavior to find device-specific layout problems
Switch to session replay when you need to diagnose
Once a heatmap surfaces an anomaly, session replay is how you find out what's actually causing it. You've identified that something is wrong — now you need to understand the mechanism. Session recordings let you watch the specific behavior that's producing the pattern you see in the heatmap.
Reach for session replay when:
A heatmap shows clicks on a non-interactive element and you want to understand the context around it
Your scroll map shows a sharp drop-off and you want to see what happens right before people leave
A form has high abandonment and you want to see exactly which field causes people to stop
A checkout step has unusual drop-off and you want to know if something looks broken
You want to understand how a specific segment — say, mobile visitors from paid traffic — actually navigates your site
Use session replay first when the problem is already specific
There are situations where you skip the heatmap entirely and go straight to recordings. If you already know the exact problem — a form on a specific page has a 60% abandonment rate at the third field — session replay is the faster diagnostic. You don't need aggregate data to tell you there's a problem; you need to watch people experience it.
Session replay first makes sense when:
You have a specific, quantified problem from your analytics and want to understand the cause
A user has reported a confusing experience and you want to replicate it
You've just shipped a change and want to watch early sessions to check for unintended behavior
You're doing usability research on a specific flow, not a broad page audit
How to use them together: the diagnostic workflow
The most effective approach pairs both tools in sequence. Here's the workflow that consistently produces actionable hypotheses:
Step 1: Identify a page with a measurable problem
Start with a page where you have data showing underperformance: a landing page converting below your site average, a checkout step with high exit rate, a product page with low add-to-cart rates. You need a specific problem to investigate — not a general sense that 'things could be better.'
Step 2: Run a heatmap to locate the anomaly
Pull a click map and scroll map for the page, split by device. You're scanning for things that shouldn't be there: clicks on non-interactive elements, a CTA that's cold when it should be hot, a scroll drop-off that doesn't correspond to a natural section break, a section that's completely ignored despite being important.
At this stage you're answering: 'Where specifically on this page is the behavioral problem?' Give yourself a 5-minute time limit — if nothing jumps out in that time, you're either looking at the wrong page or you need more session data before the patterns become reliable.
Step 3: Filter session recordings to match the anomaly
Once you've spotted something in the heatmap, filter your session recordings to users who triggered that behavior. Most tools let you filter by: pages visited, elements clicked, scroll depth reached, session duration, device type, traffic source. Set up a filter that isolates sessions where visitors interacted with — or failed to interact with — the element flagged in the heatmap.
Step 4: Watch 10–20 sessions
You don't need to watch hundreds. In most cases, a clear pattern emerges within the first 10–15 sessions. You're watching for the specific moment things go wrong: the hesitation before a click, the repeated tap on a broken button, the scroll that goes right past your CTA, the form field where people consistently stop typing.
Most practitioners describe this as the moment conversion rate optimization becomes concrete. You stop looking at percentages and start watching people. The problem usually becomes obvious very quickly — and equally obvious is what needs to change.
Step 5: Form a specific hypothesis
Convert what you observed into a testable statement. Not 'the page needs to be redesigned' — but 'visitors on mobile are scrolling past the CTA because the product image above it is tall enough to create a false bottom, making the page look complete. Moving the CTA above the image should increase mobile click-through rate on the primary action.'
That's specific enough to implement, measure, and verify with a follow-up heatmap.
Common mistakes when using both tools
Using session replay before you know what you're looking for
Pulling up session recordings without a diagnostic question is one of the least efficient ways to spend CRO time. You end up watching sessions randomly, looking for 'something interesting,' and usually confirming what you already assumed rather than discovering what you didn't know. Use a heatmap first to get a hypothesis, then use recordings to investigate it.
Treating heatmap findings as conclusions
A heatmap tells you that visitors aren't clicking your CTA. It does not tell you why. Treating the heatmap finding as the final answer — 'the CTA isn't working, so let's make it bigger' — skips the diagnostic step that actually tells you what to change. The CTA might be getting ignored because it's below a false bottom. Or because the copy isn't compelling. Or because visitors are confused about what they're signing up for. Only session replay can tell you which.
Not segmenting either tool
An unsegmented heatmap blends mobile and desktop behavior, paid and organic traffic, new and returning visitors. An unsegmented recording filter returns a random mix of sessions that may not be relevant to the problem you're investigating. Before drawing conclusions from either tool, filter by at minimum device type and traffic source. The behavior you want to understand is almost always more visible in a specific segment than in the aggregate.
Waiting too long to act on what you find
The workflow breaks down when findings sit in a doc for three weeks before anyone acts on them. The value of behavioral data is in its specificity — you watched people struggle with a specific element on a specific page. That finding has a short shelf life, because the page might change, traffic mix might shift, or the problem might compound. Build the hypothesis and test it while the observation is fresh.
Frequently asked questions
What is the difference between session replay and a heatmap?
A heatmap aggregates behavior across all visitors and shows patterns — where most people click, how far most people scroll. Session replay captures one visitor's complete session so you can watch exactly what they did. Use heatmaps to identify what's happening across your audience; use session replay to understand why specific visitors behave the way they do.
Do I need both session replay and heatmaps?
Yes — they answer different questions and neither substitutes for the other. Heatmaps surface anomalies across your entire audience quickly. Session replay explains the cause of those anomalies in specific detail. Teams that use only heatmaps often make changes based on patterns without understanding the mechanism. Teams that use only session replay often miss widespread problems because they're watching individual sessions without context.
What is session replay used for?
Session replay is most useful for diagnosing specific, known problems — a high form abandonment rate, cart drop-off at a particular step, a page element that's getting clicks when it shouldn't. It's also useful for watching early sessions after a page change to catch unintended behavior, and for understanding how specific user segments (mobile visitors, first-time visitors, visitors from a specific campaign) navigate your site.
How many session recordings do I need to watch?
Typically 10–20 recordings is enough to identify a clear pattern. You're not trying to build a statistically significant sample — you're watching for qualitative patterns that repeat. If you've watched 20 sessions and no consistent pattern has emerged, either your filter is too broad, or the problem is more subtle and requires a larger sample before the signal becomes clear.
Can I use session replay without heatmaps?
Yes, particularly when you already have a specific, quantified problem from your analytics. If you know that 55% of visitors abandon your checkout at the payment step, you don't need a heatmap to tell you there's a problem — you need session recordings to show you what's happening at that step. For broad page audits where you don't yet know where to look, starting with a heatmap is faster.
Lucky Orange includes heatmaps and session recordings in the same dashboard — no switching tools, no exporting data. You can go from spotting an anomaly in a heatmap to watching the recordings that caused it in a few clicks. Try it free →
Lucky Orange