Blog
Conversion Rate Optimization
What Is a Website Heatmap? How It Works and How to Actually Use One
A website heatmap shows you exactly where visitors click, scroll, and move — so you can stop guessing and start fixing what's hurting conversions. Here's how they work and how to use them.
Lucky Orange
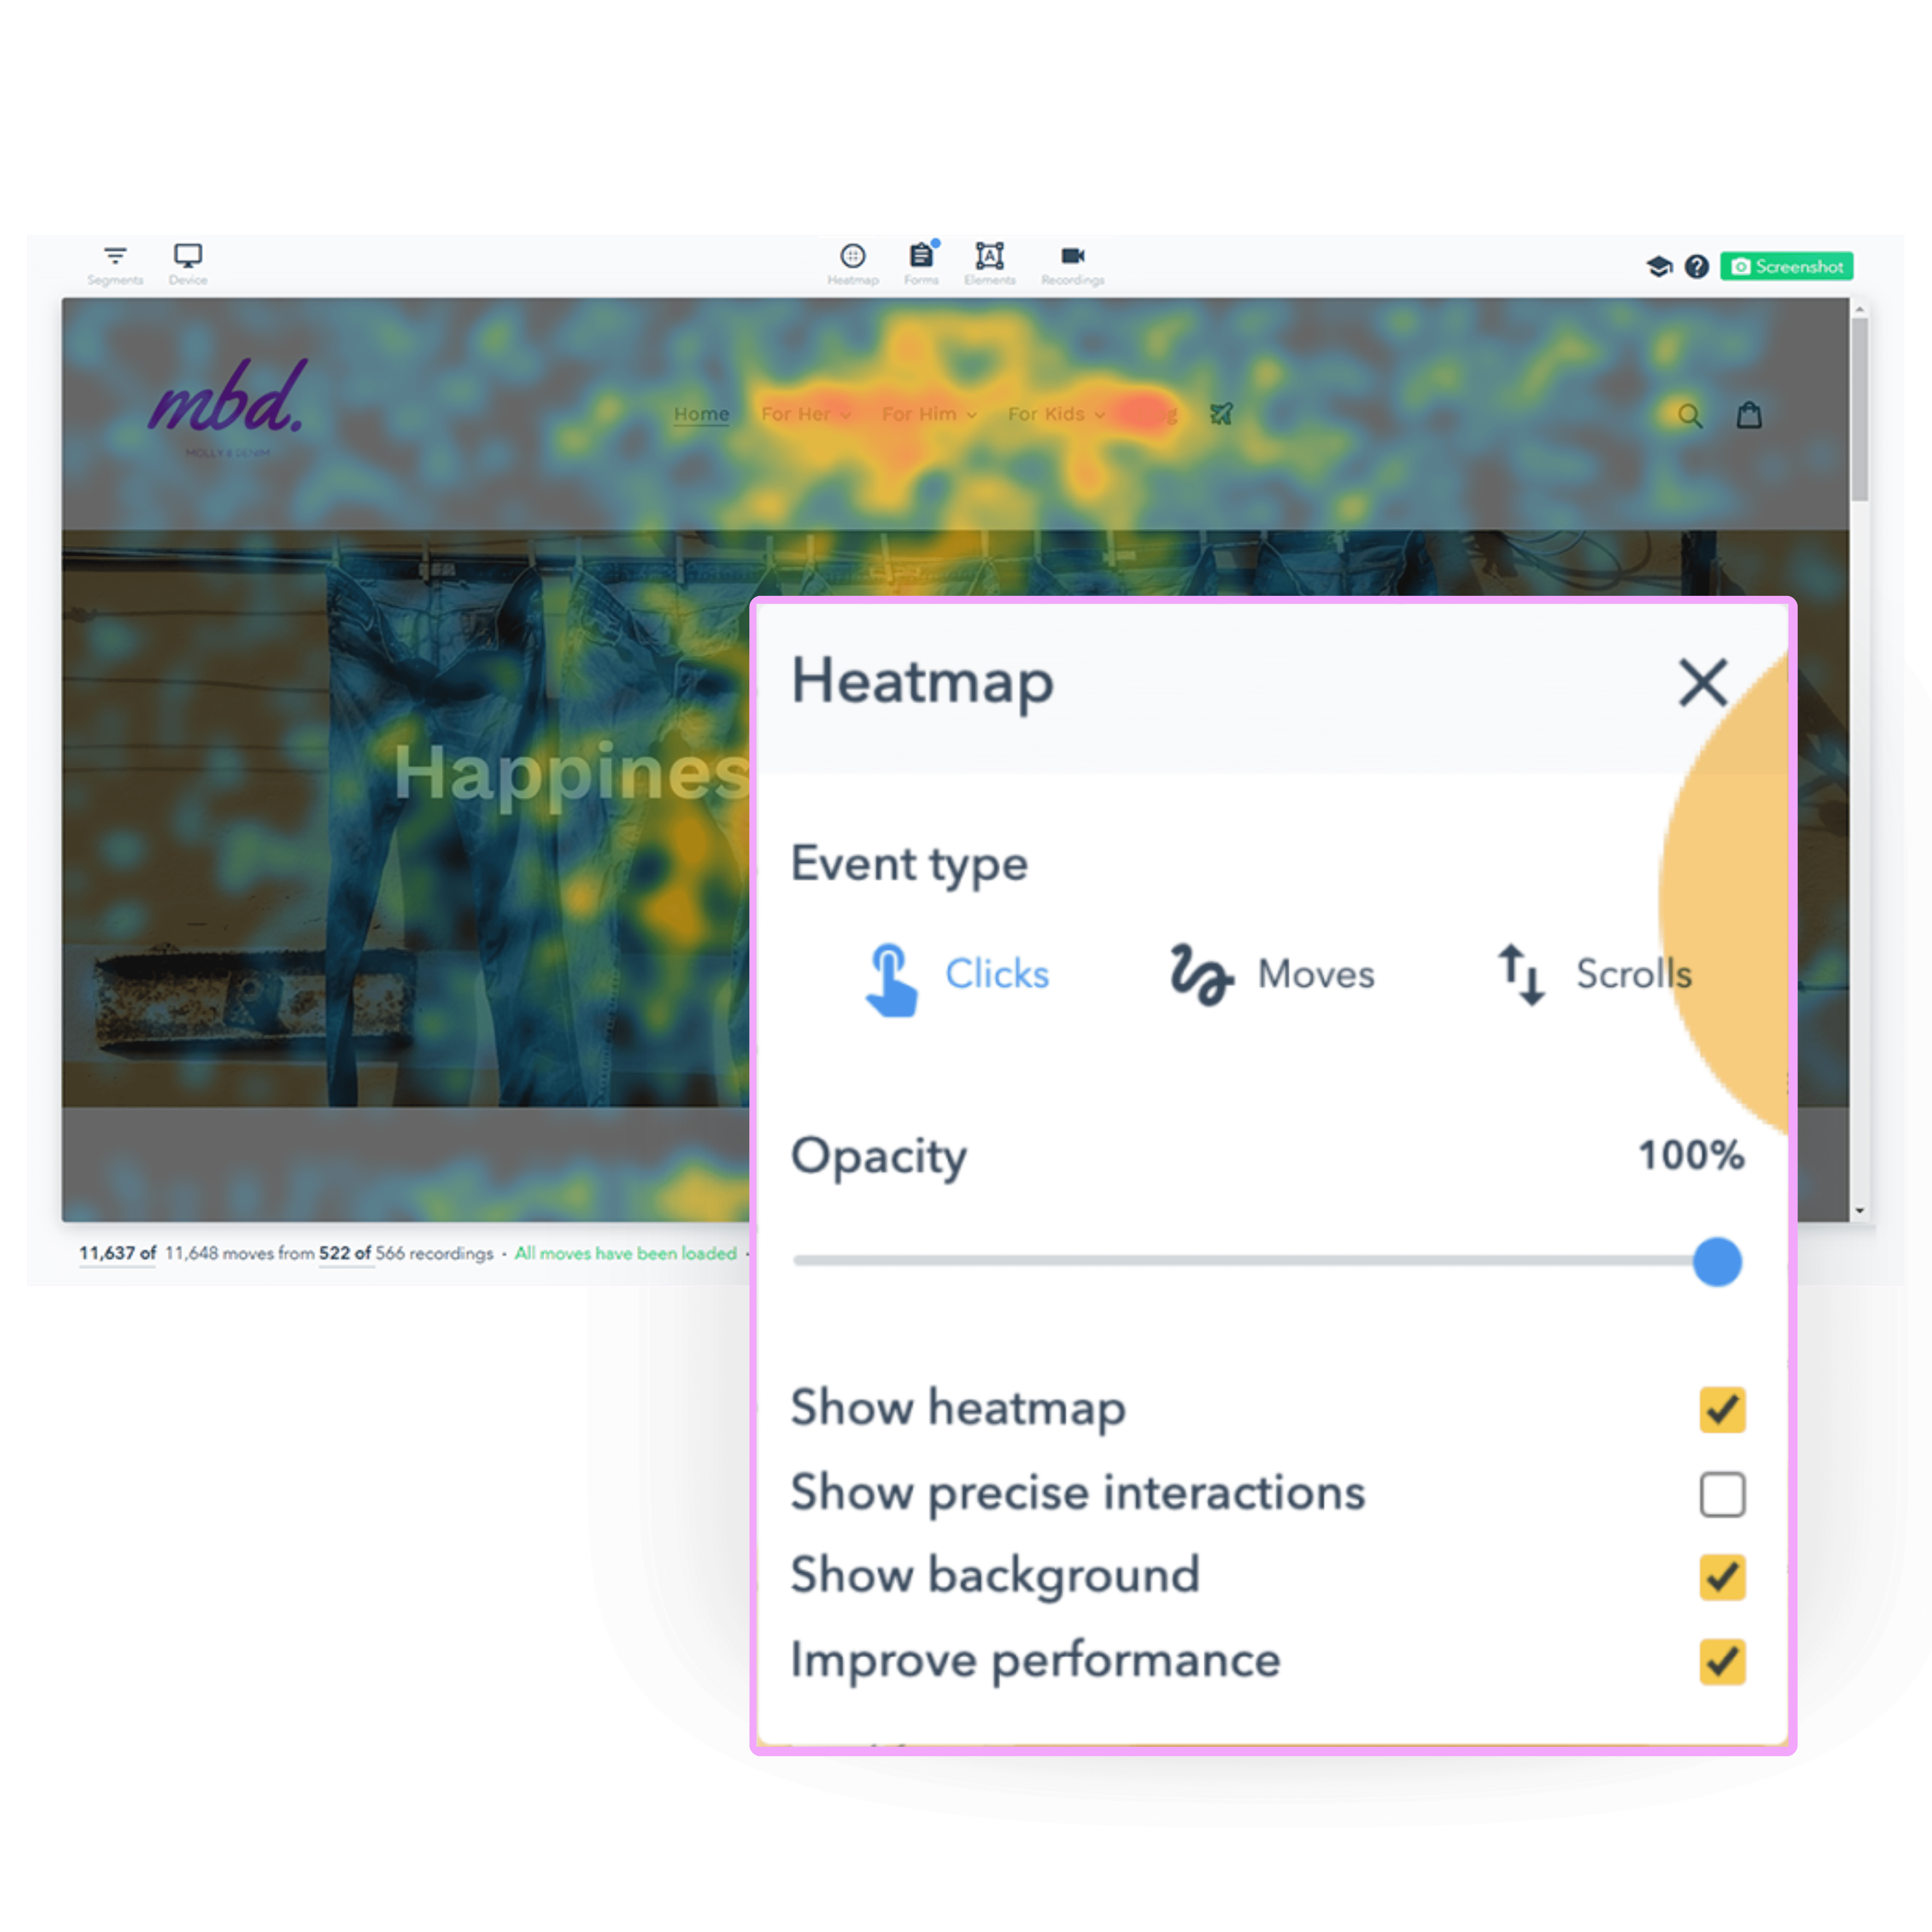
A website heatmap is a visual representation of where visitors click, scroll, and move their mouse on a page — aggregated across hundreds or thousands of sessions and rendered as a color-coded overlay. Red and orange zones are where most activity concentrates. Blue and green zones are where it drops off. Blank space means no engagement at all.
That's the textbook definition. But what heatmaps are actually useful for is narrower and more specific: they tell you which parts of your page aren't doing the job they're supposed to do — and they give you a place to start when you're trying to figure out why a page converts at 1.8% when it should be converting at 4%.
This guide covers how website heatmaps work technically, the four types you'll actually use, how to read them without drawing the wrong conclusions, and the workflow for turning heatmap data into page changes that move metrics.
How a website heatmap works
When you add a heatmap tool to your site — typically a small JavaScript snippet in your page header — it starts recording how visitors interact with each element on the page. Every click, scroll depth, and mouse movement is captured and sent back to the tool's servers in real time.
Once enough sessions accumulate, the tool creates an aggregate overlay on top of a screenshot or live render of your page. Interactions are weighted and plotted spatially. Areas with the most activity get warm colors; areas with little or no activity go cool or transparent.
A few things worth understanding about how data collection actually works:
Heatmaps are aggregate views. They show patterns across all your visitors, not individual sessions. If you need to understand what a specific user did, that's what session recordings are for. Heatmaps tell you 'most people do X here'; recordings tell you 'here's exactly what this person did.'
Sample size matters. A heatmap built on 50 sessions will mislead you. The patterns you see at 50 sessions look completely different at 500. A good rule of thumb: don't draw conclusions until you have at least 1,000 sessions for a specific page, and segment separately for mobile vs. desktop.
Dynamic content needs special handling. If your page includes popups, sticky headers, infinite scroll, or AJAX-loaded content, make sure your heatmap tool explicitly supports tracking those interactions. Many tools miss dynamic elements by default.
Mobile and desktop need separate maps. Users on mobile tap and scroll very differently than desktop users. A combined heatmap across all devices produces a blended view that accurately represents neither audience. Always split them.
The four types of website heatmaps — and when to use each
Not all heatmaps show the same thing. Each type captures a different behavioral signal, and knowing which one to pull for a given question saves you from spending time reading data that doesn't answer what you're actually asking.
Click maps
A click map shows where visitors click — on buttons, links, images, text, and empty space. The density of clicks in each area is reflected in the color intensity.
Use a click map when you want to answer:
Are people clicking my primary CTA — or something else entirely?
Are visitors clicking elements that aren't clickable (which creates friction and frustration)?
Which of my navigation links actually get used vs. which are dead weight?
Is that image or icon drawing clicks away from where I want people to go?
One of the highest-signal findings from click maps is rage clicks — repeated rapid clicks on a non-responsive element. If you see a cluster of rage clicks on a button or link, something is broken or the element looks interactive but isn't.
Scroll maps
A scroll map shows how far down the page your visitors scroll before leaving. The percentage of visitors who reach each depth is shown as a gradient — the page gets progressively cooler the lower you go, since fewer people make it there.
Use a scroll map when you want to answer:
Where does most of my traffic drop off on this page?
Is my CTA positioned where visitors actually reach, or is it below the fold for 70% of my audience?
Am I burying key information — pricing, social proof, the form — below a drop-off point?
The classic scroll map insight: your page has a sharp drop-off at a specific depth. That depth almost always corresponds to either a visual 'false bottom' (something that looks like it ends the page) or a section so uninteresting that people bail. Both are fixable once you can see them.
Move maps (mouse movement heatmaps)
Move maps track where visitors hover their cursor as they navigate your page. Research shows a meaningful correlation between where people move their mouse and where their eyes go — making move maps a proxy for attention on desktop.
Use a move map when you want to answer:
Which sections of my page are people actually reading vs. scanning past?
Is a specific element — headline, image, table — drawing disproportionate attention?
Where does attention cluster on long-form pages like blog posts or landing pages?
Move maps are most useful on desktop. On mobile, cursor data doesn't exist — use tap maps and scroll maps instead.
Attention and engagement heatmaps
Some tools — including Lucky Orange — offer heatmaps that combine multiple signals (clicks, scrolls, time on element) into a unified attention score per page section. These give you a more complete picture of engagement than any single map type, especially for pages where content is the core conversion driver.
These are best used for content pages — blog posts, long-form landing pages, feature pages — where you want to understand which sections drive engagement and which are invisible.
How to read a heatmap without drawing the wrong conclusions
Heatmaps are intuitive to look at and surprisingly easy to misread. Here are the most common interpretation errors practitioners make — and what to watch for instead.
Hot doesn't always mean good
A red zone on a click map means a lot of people clicked there. That's it. It doesn't tell you whether those clicks led anywhere useful or drove conversions. If your navigation menu is the hottest zone on a landing page, that's a problem — people are leaving the page instead of converting. High click volume on an exit link or a secondary CTA is a red zone you want to reduce, not celebrate.
Always ask: should this element be getting this much attention? If the hottest zone on your checkout page is your 'Maybe later' link, you have a problem that a heatmap just surfaced.
Segment before you draw conclusions
An unsegmented heatmap blends the behavior of everyone who hit that page — first-time visitors, returning customers, mobile users, desktop users, people who arrived from paid ads, and people who came from a blog post. These groups behave very differently.
Before interpreting patterns, filter at minimum by device type and traffic source. A scroll map for mobile visitors will look completely different from desktop. Click patterns from paid traffic often differ dramatically from organic traffic. The aggregate view isn't wrong — it's just not specific enough to act on.
Pair heatmaps with session recordings to diagnose why
A heatmap tells you what's happening. It doesn't tell you why. If your scroll map shows a 60% drop-off halfway down your pricing page, the heatmap can't tell you whether it's because the content isn't compelling, the page is too long, the copy triggers an objection, or something looks broken on a certain viewport.
Session recordings are the diagnostic layer. When you spot something unexpected in a heatmap, pull 10–20 session recordings of users who dropped off at that point or clicked the unexpected element. In most cases, watching real sessions will tell you within minutes what the heatmap can only flag.
The heatmap workflow: from data to page change
A heatmap with no action attached to it is just a pretty picture. Here's the diagnostic workflow for turning heatmap data into hypotheses you can actually test.
Step 1: Start with pages that already have a problem
Don't run heatmaps on every page hoping to find something interesting. That's noise. Instead, start with pages that have a measurable performance problem: a landing page converting below your site average, a checkout step with high abandonment, a product page with low add-to-cart rates.
You already know something is wrong. The heatmap helps you figure out where to look.
Step 2: Pull the right map for the question
Match your map type to the question you're trying to answer. If you're asking 'are people seeing my CTA,' start with a scroll map to check whether most visitors even reach it. If you're asking 'why isn't my CTA being clicked,' move to a click map. If you suspect a section of copy isn't being read, pull a move map.
Step 3: Identify the anomaly
Scan for the things that shouldn't be there: hot zones on non-clickable elements, cold zones on your primary CTA, sharp scroll drop-offs that don't correspond to a page section break, clicks on images that people seem to expect to be links.
Also look for what's missing. If a section you invested in — a testimonial block, a feature table, a value proposition — is getting zero engagement, that's as actionable as a rage click cluster.
Step 4: Watch the sessions that correspond to the anomaly
Filter your session recordings to users who triggered the behavior you spotted in the heatmap — people who dropped off at that depth, people who clicked that non-interactive element, people who ignored your CTA. Watch 10–20 sessions. You will almost always see a clear pattern within the first few.
Step 5: Form a specific hypothesis and test it
Convert your observation into a testable hypothesis. Not 'the page needs to be better' — but 'visitors are dropping off at the pricing section because the monthly/annual toggle is below the fold for mobile users, so we're going to move it above the pricing table and expect to see a reduction in drop-off and an increase in plan selections.' That's a hypothesis you can verify.
Run the change. Measure it against the original. Then run another heatmap on the updated page to confirm the behavior shifted the way you expected. This loop — observe, hypothesize, change, verify — is the core CRO process that heatmaps are built to support.
What to look for on different page types
Different page types have predictable heatmap patterns worth knowing before you start interpreting your own data.
Landing pages
Click map: Is the primary CTA the hottest element above the fold? If your hero image or navigation is getting more clicks, something is competing with your conversion goal.
Scroll map: What percentage of visitors actually reach your social proof section, your feature list, your secondary CTA? If it's under 30%, most visitors are making a yes/no decision before they see your supporting arguments.
Product and ecommerce pages
Click map: Are people clicking through product images? Trying to click the product image to zoom but your zoom function doesn't trigger intuitively? Are they clicking your shipping/returns policy more than your Add to Cart button — a signal of anxiety before purchase?
Scroll map: Do most users reach your reviews section? Reviews are one of the strongest purchase drivers — if 70% of your visitors never see them, moving them higher up the page is one of the easiest lifts available.
Blog posts and long-form content
Scroll map: Where does engagement drop off? If you see a cliff at a specific section, that section may be too long, too dense, or structurally breaking reading flow. It's also where you should not bury your in-content CTA.
Click map: Are your internal links being clicked? If your in-content links to related posts are getting zero engagement, your anchor text isn't compelling or they're not placed where attention lives.
Common heatmap mistakes — and how to avoid them
Acting on too little data. Running a heatmap for two days and making page changes based on 80 sessions is how you introduce noise as signal. Set a minimum session threshold before you interpret results.
Not splitting mobile and desktop. This produces a blended view that accurately represents no one. Set up separate heatmaps or filter by device before you draw any conclusions.
Using heatmaps in isolation. Heatmaps are most powerful when layered with session recordings, conversion funnel data, and form analytics. A heatmap tells you where — recordings tell you why — funnels tell you how often.
Confirming what you already think. It's easy to look at a heatmap and see what you were hoping to see. Look specifically for patterns that contradict your assumptions. That's where the valuable findings live.
Not re-running after changes. Once you change a page based on heatmap findings, run a new heatmap on the updated page. You want to verify that user behavior shifted the way you expected — and catch anything the change introduced.
How to set up a website heatmap
Setup is straightforward with any modern heatmap tool. In Lucky Orange, you add a single JavaScript snippet to your site — the same snippet that enables session recordings, live view, and your analytics dashboard — and heatmaps start capturing immediately. No separate installation required per page.
A few configuration choices worth making at setup:
Set a session sample rate if you have very high traffic. On sites with millions of monthly visitors, recording 100% of sessions for heatmaps generates more data than you need. A 10–20% sample on high-traffic pages is sufficient.
Exclude internal traffic. Your team's own visits to the site will pollute your heatmaps with non-representative behavior. Exclude your office IP or set a cookie exclusion.
Prioritize your highest-impact pages first. You don't need a heatmap on every page simultaneously. Start with pages that directly touch conversion: landing pages, pricing, checkout, key product pages.
Set up device-split views from the start. Configure separate views for mobile and desktop so you're never looking at blended data you have to manually segment later.
The bottom line
A website heatmap is the fastest way to go from 'this page isn't converting well' to 'here's specifically what visitors are doing instead of converting and here's where to start.' It won't give you the full picture on its own — that requires pairing it with session recordings and conversion funnel data — but it gives you the spatial view of user behavior that no amount of traffic data can provide.
The teams that get the most out of heatmaps treat them not as a one-time audit tool but as part of a regular diagnostic process: run heatmaps on key pages, identify the top anomaly, watch the sessions, form a hypothesis, make a change, verify it with a new heatmap. Repeat.
If you're not doing this yet, the setup takes about ten minutes. The first insight you'll find usually takes less than an hour.
Lucky Orange