Blog
News & Updates
Product Release: Heatmap Analysis Quick Action
We're excited to announce one-click analysis of all your heatmap data using Lucky Orange Discovery AI. Here's how it works.

Sean McCarthy
Director of Marketing

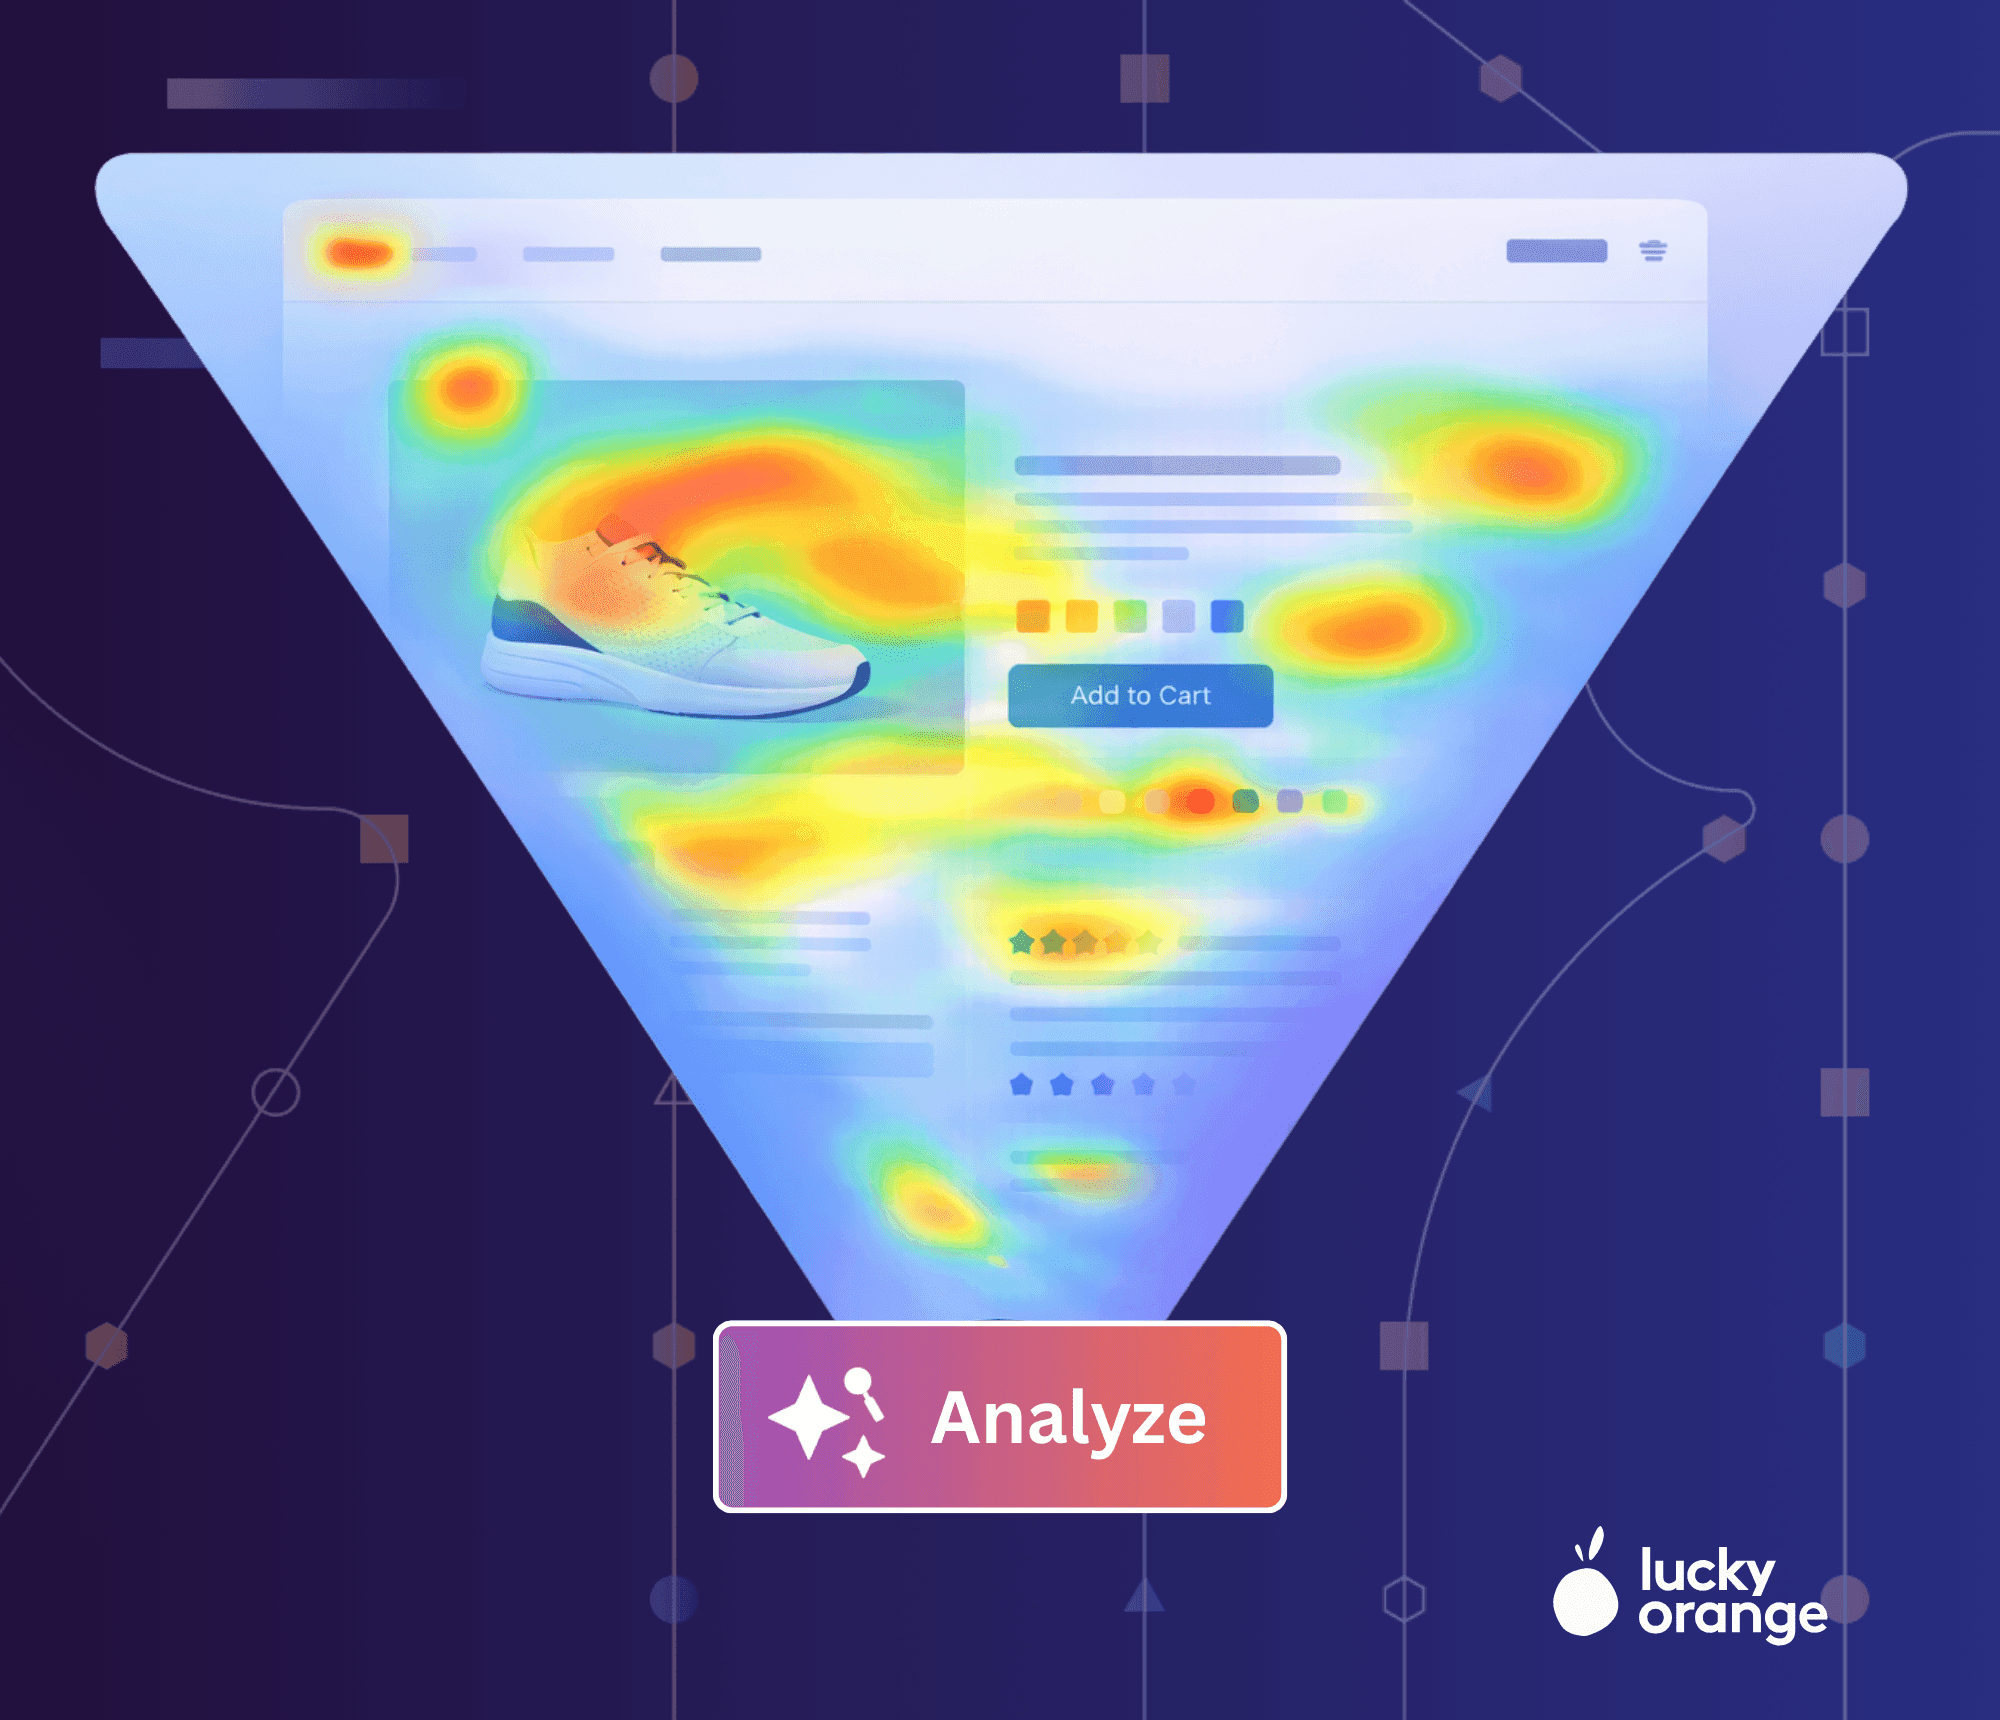
You already launched the heatmap.
You studied the scroll depth. You noted the hot spots. You thought about what it all means.
And then you moved on — because translating a heatmap into a hypothesis takes time you don't always have.
The gap between data and insight
Heatmaps are one of the most powerful tools in conversion optimization. But they require interpretation — and that interpretation has always landed on you.
You see the drop-off. But why? You see the click cluster. But what does it mean? You see low engagement on mobile. But what should you change?
The data has always been there. The narrative hasn't.
What we built
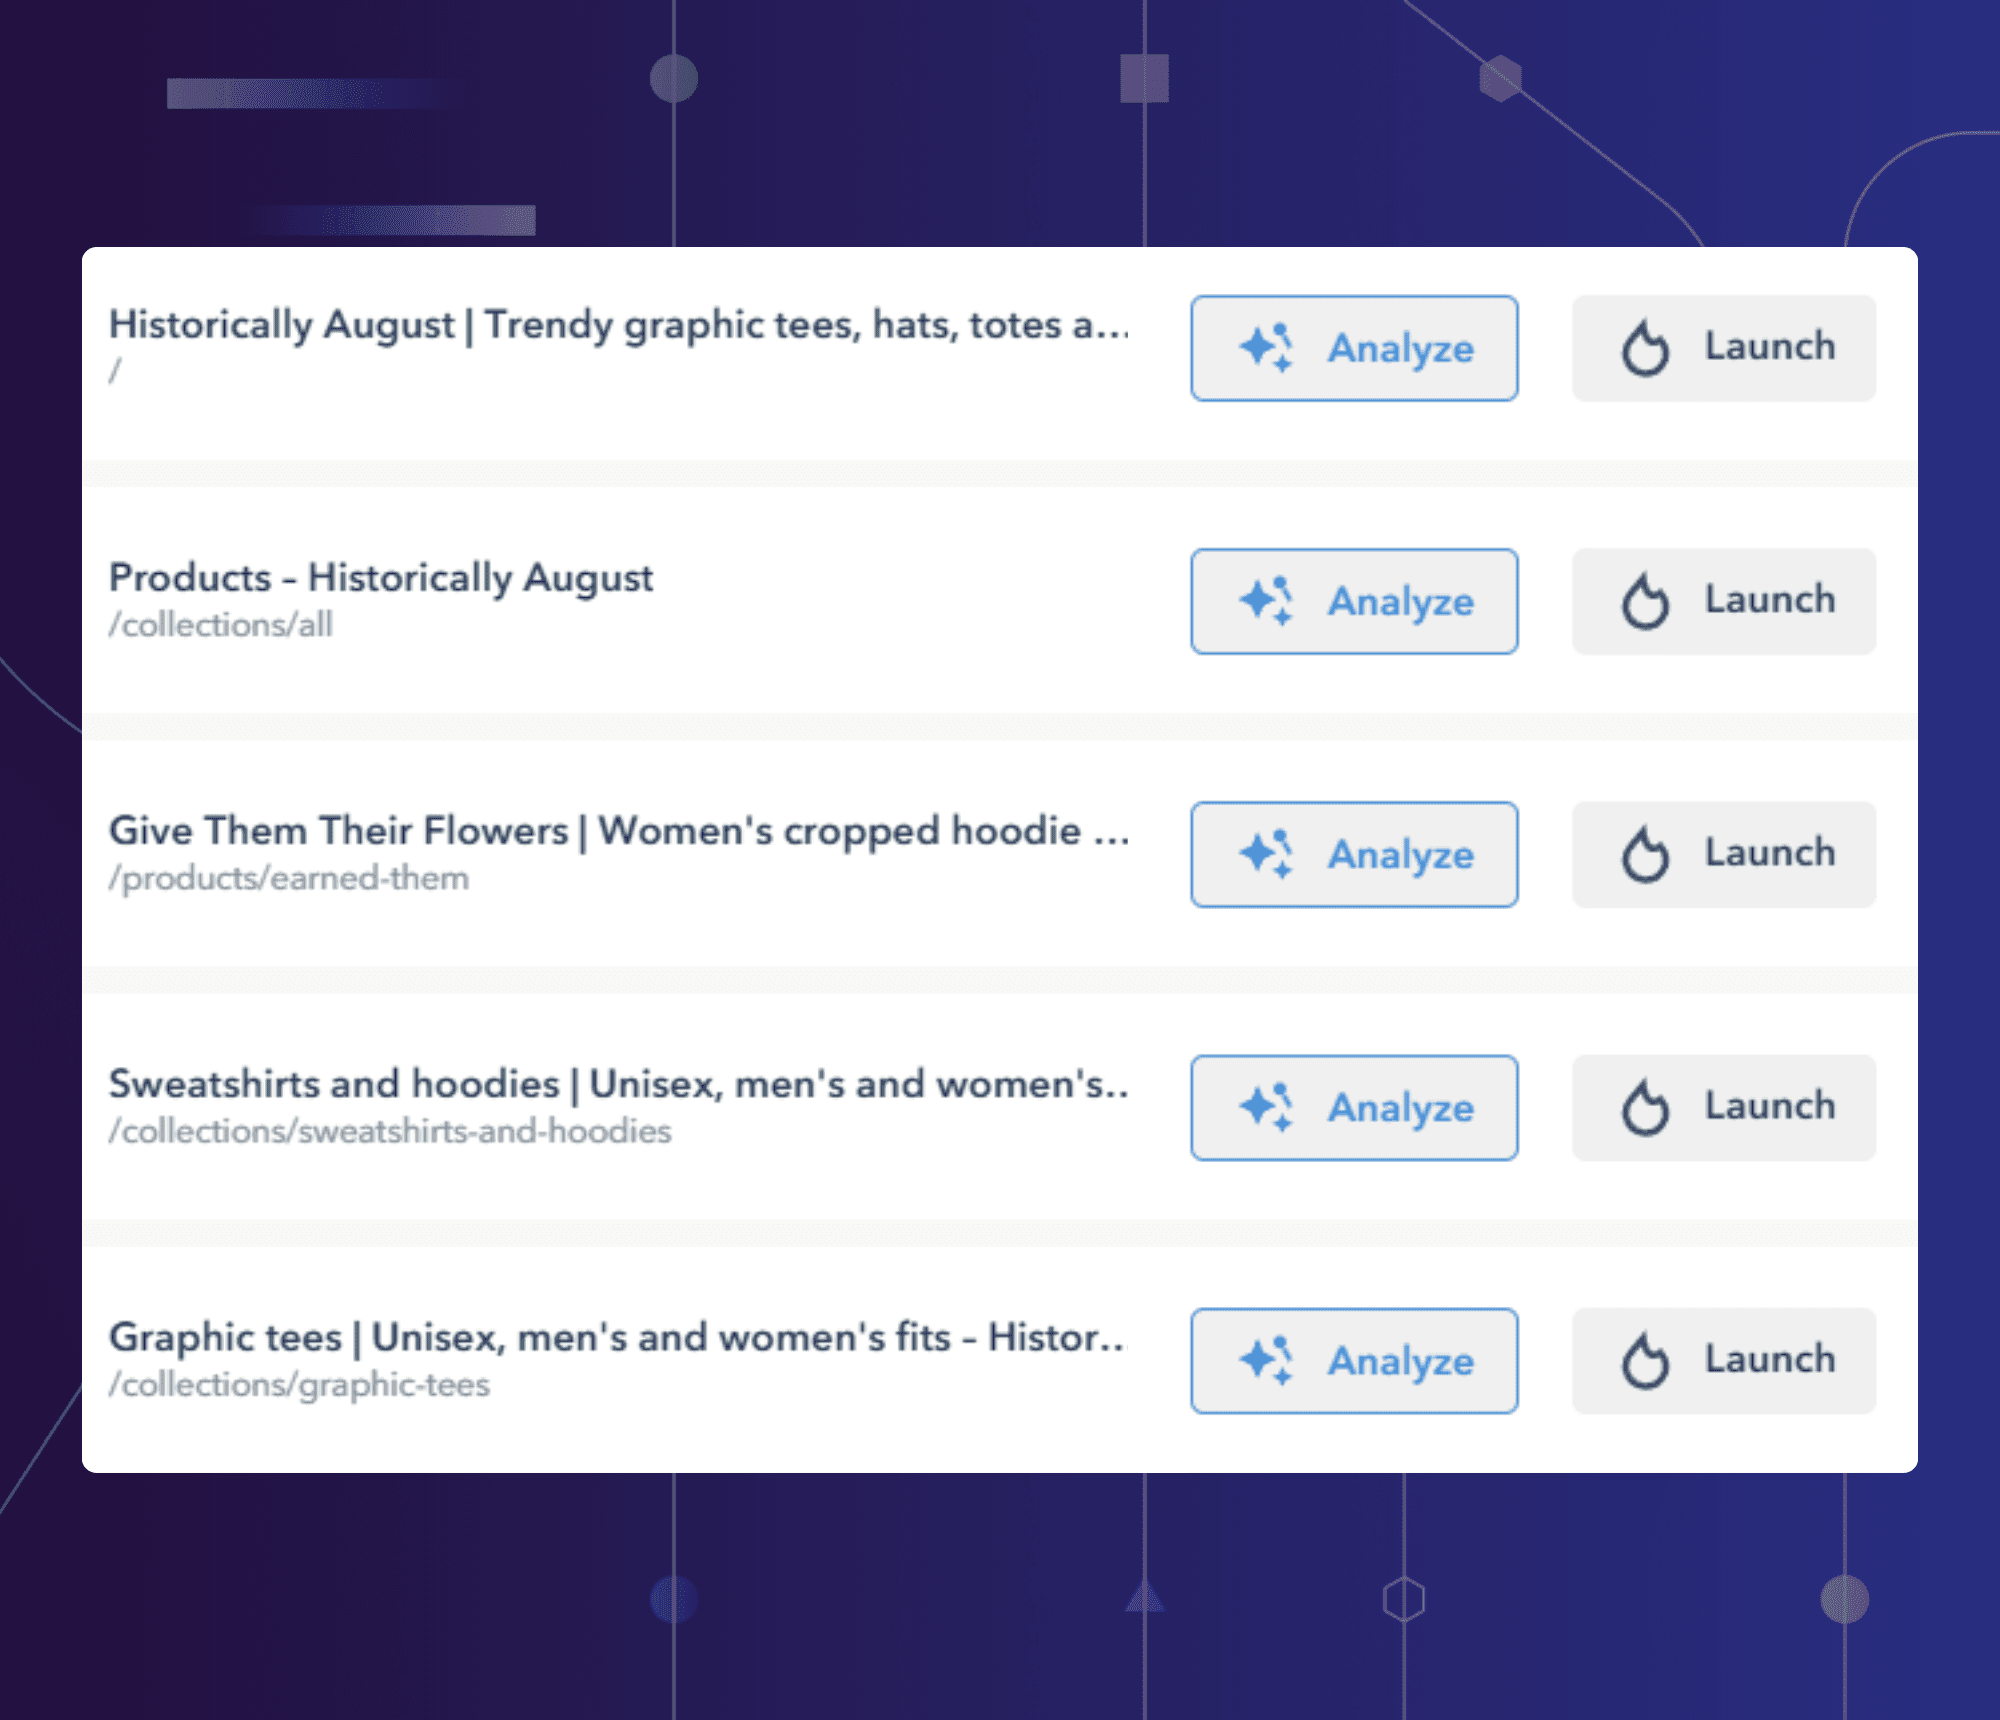
Inside Lucky Orange, head to Analytics > Heatmaps. You'll find a list of your most engaged pages — you've always been able to launch a visual heatmap from here.
Now there's an Analyze button.
Click it, and Discovery AI opens automatically — already loaded with a full analysis of that page's heatmap data. No prompting required. No copy-pasting. No context-switching.
Here's what the analysis covers:
Scroll evaluation: how far users scroll on desktop vs. mobile, effective fold depth, and where most visitors stop engaging
Click evaluation: which elements attract the most clicks, what percentage of total interaction they account for, and any behavioral anomalies
Interesting visitor groups: segments that behave meaningfully differently from the average
Next steps: specific recommendations for what to investigate, test, or change
The visual heatmap is still right there if you want it. Click through any time for visual confirmation.
But in a discovery-led CRO workflow, the analysis should come first. The Quick Action makes that the default.
The workflow
Go to Analytics > Heatmaps
Choose or search for any page on your site
Click Analyze
Read your Discovery AI analysis — scroll behavior, clicks, standout segments, next steps
Ask follow-up questions if you want to go deeper
Launch the visual heatmap anytime for confirmation
Why it matters
Discovery AI exists to be the starting point for optimization — the place where data becomes direction. The Heatmap Analysis Quick Action extends that philosophy to one of the most data-rich tools in your stack.
It's a small change to the workflow. But it's the difference between a heatmap that informs and one that just sits there looking colorful.
Not yet a Lucky Orange user? Start your free trial →
Sean McCarthy
Director of Marketing


